【Bitcoin Options Analysis】 Nov 19 Primarily based on GEX data
Here is a look at the current Bitcoin market.
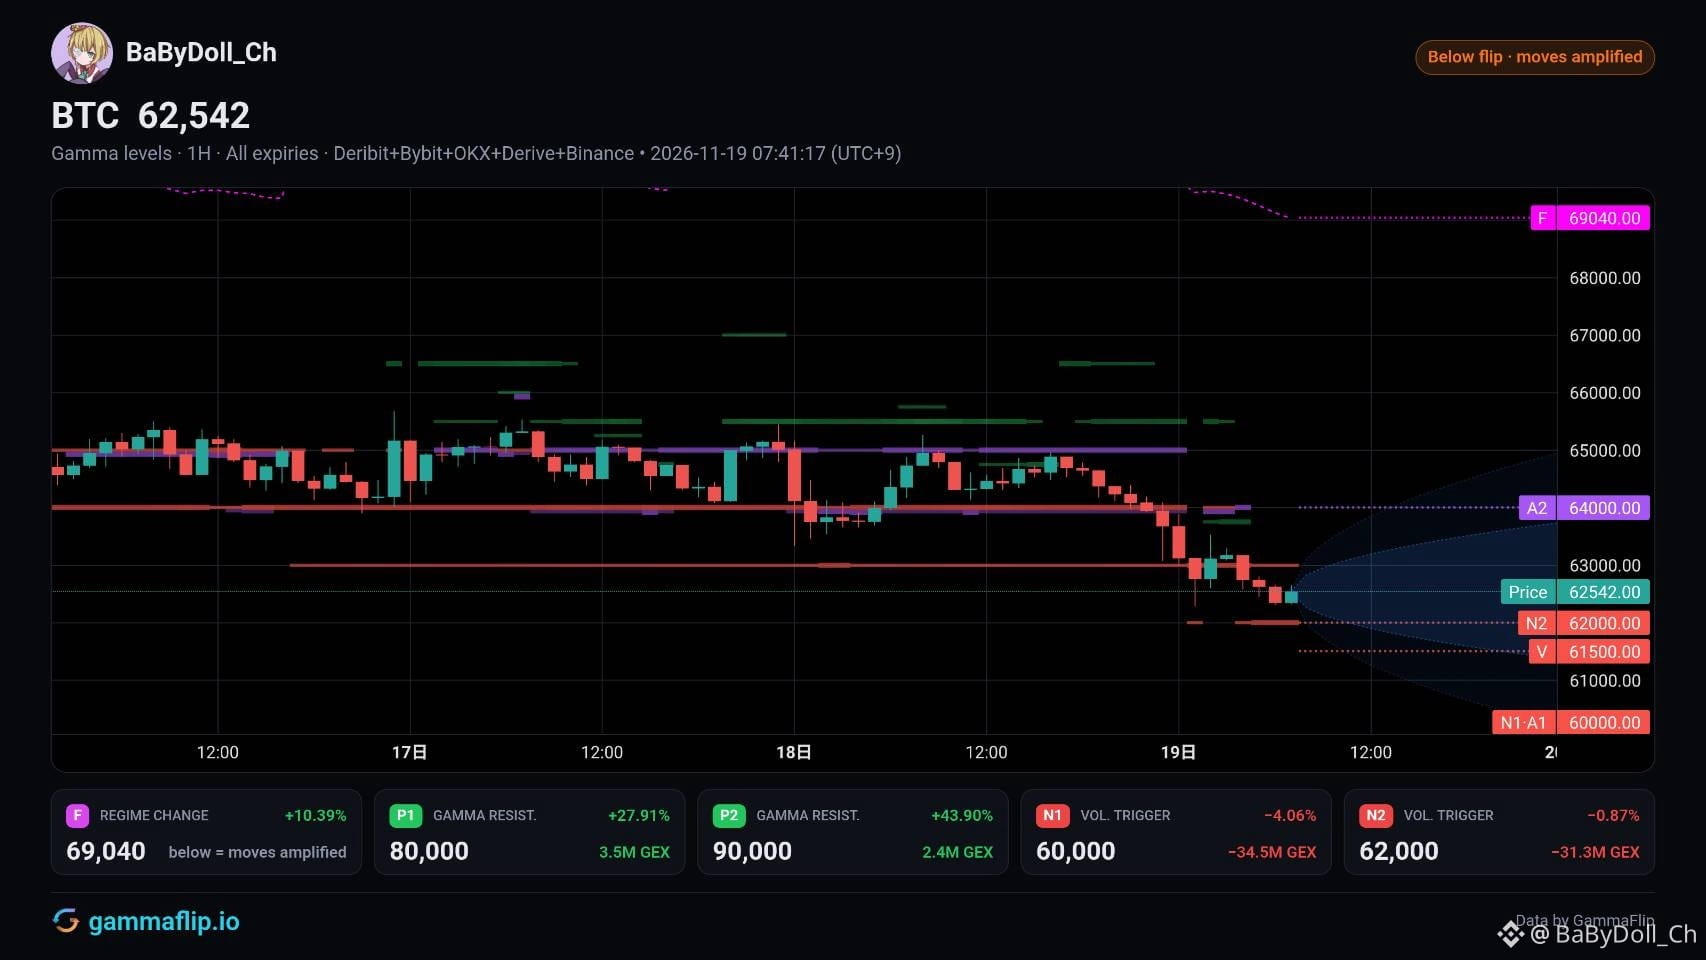
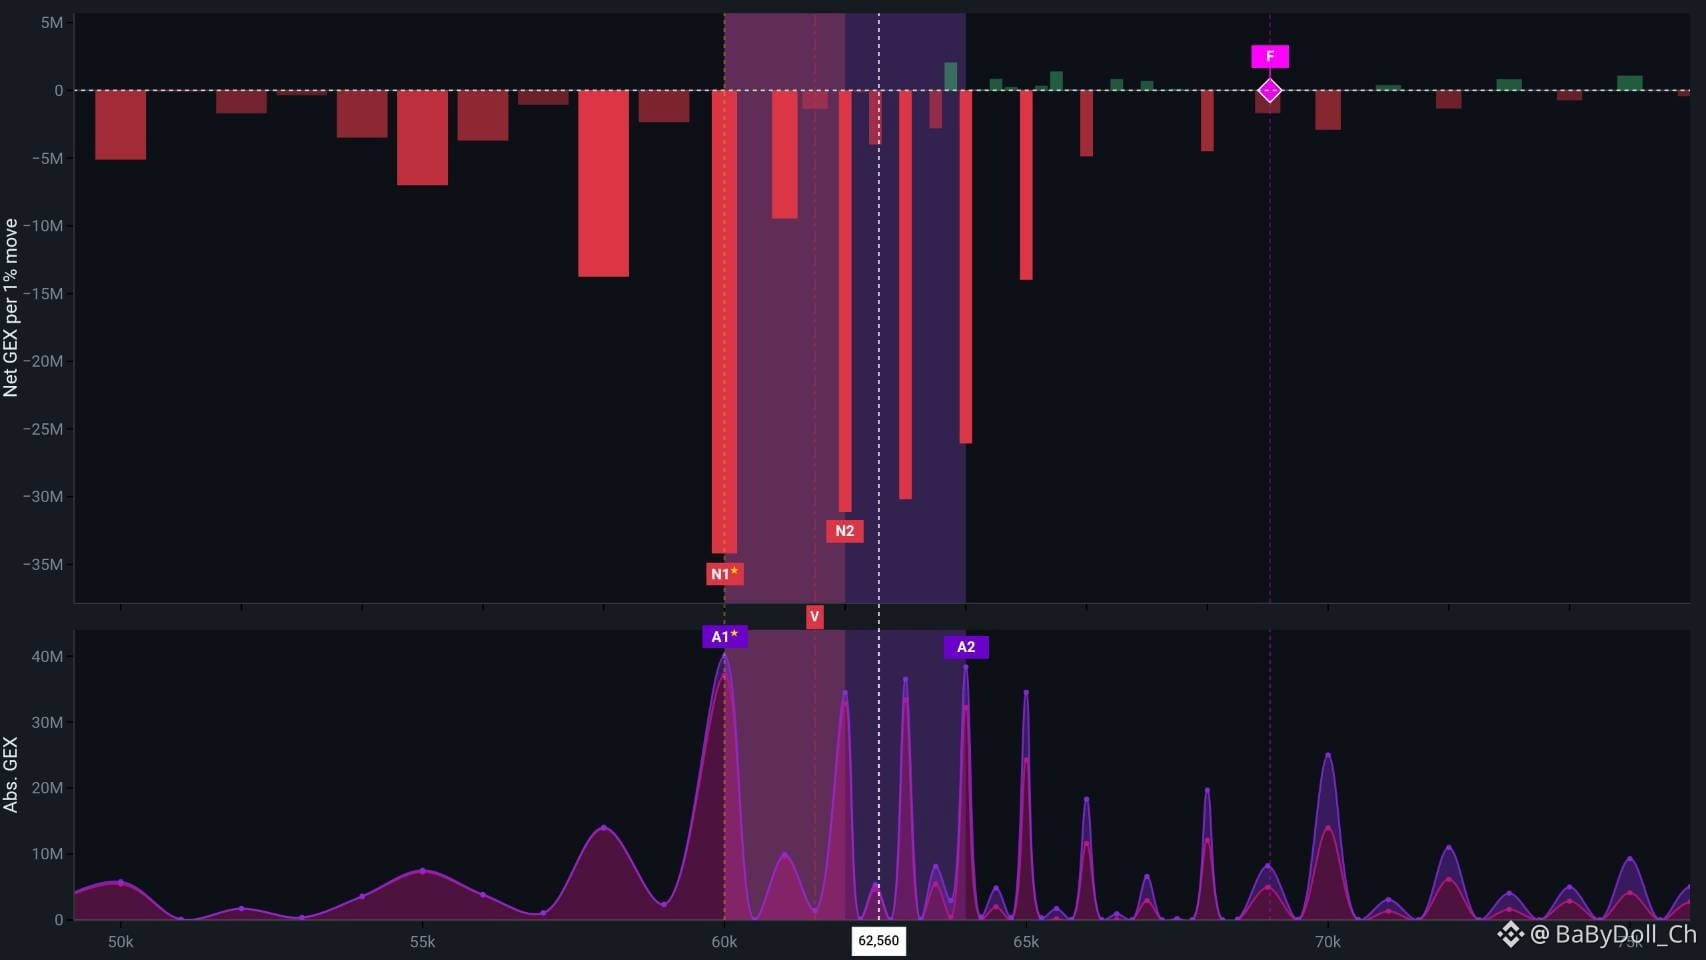
Hedging demand is concentrated around $60,000–$64,000.
The nearest overhead options wall is around $66,000, where upward price moves may encounter resistance.
$60,000 remains a key level to watch. A break below it could trigger additional selling through delta hedging by market makers.
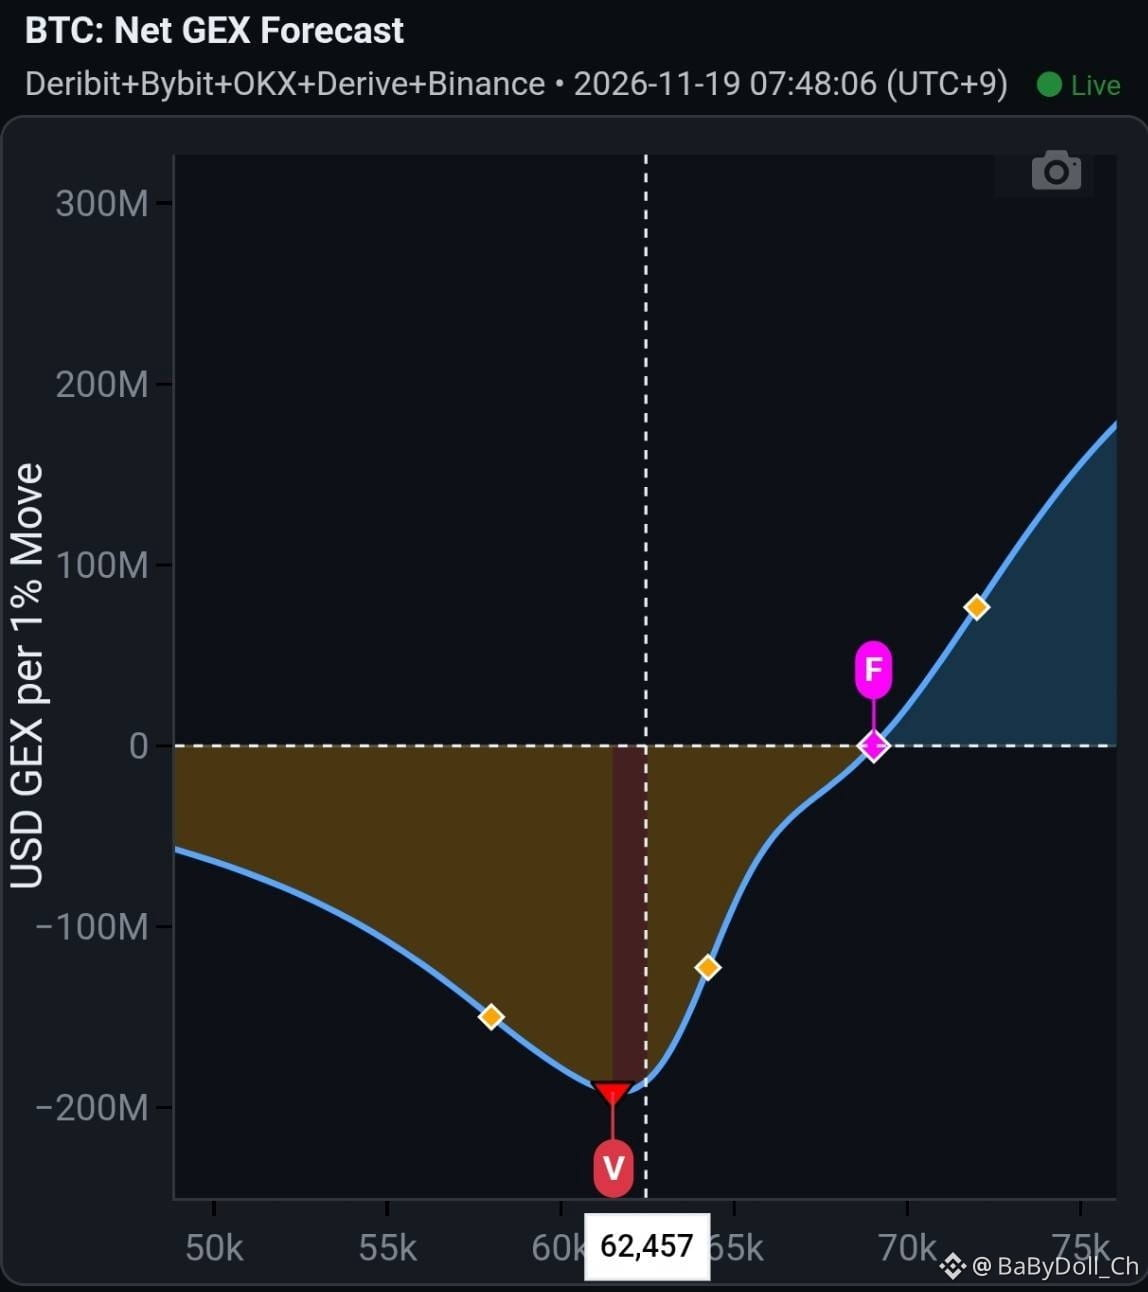
The key gamma flip level is around $69,000, with BTC currently trading below it.
Below this level, larger price swings are a concern, and technical support and resistance levels may be less effective.
Reclaiming $70,000 and holding above it remains an important focus.
“BTC is currently in a regime where hedging flows from market makers may amplify price moves in either direction.” (Image 3)
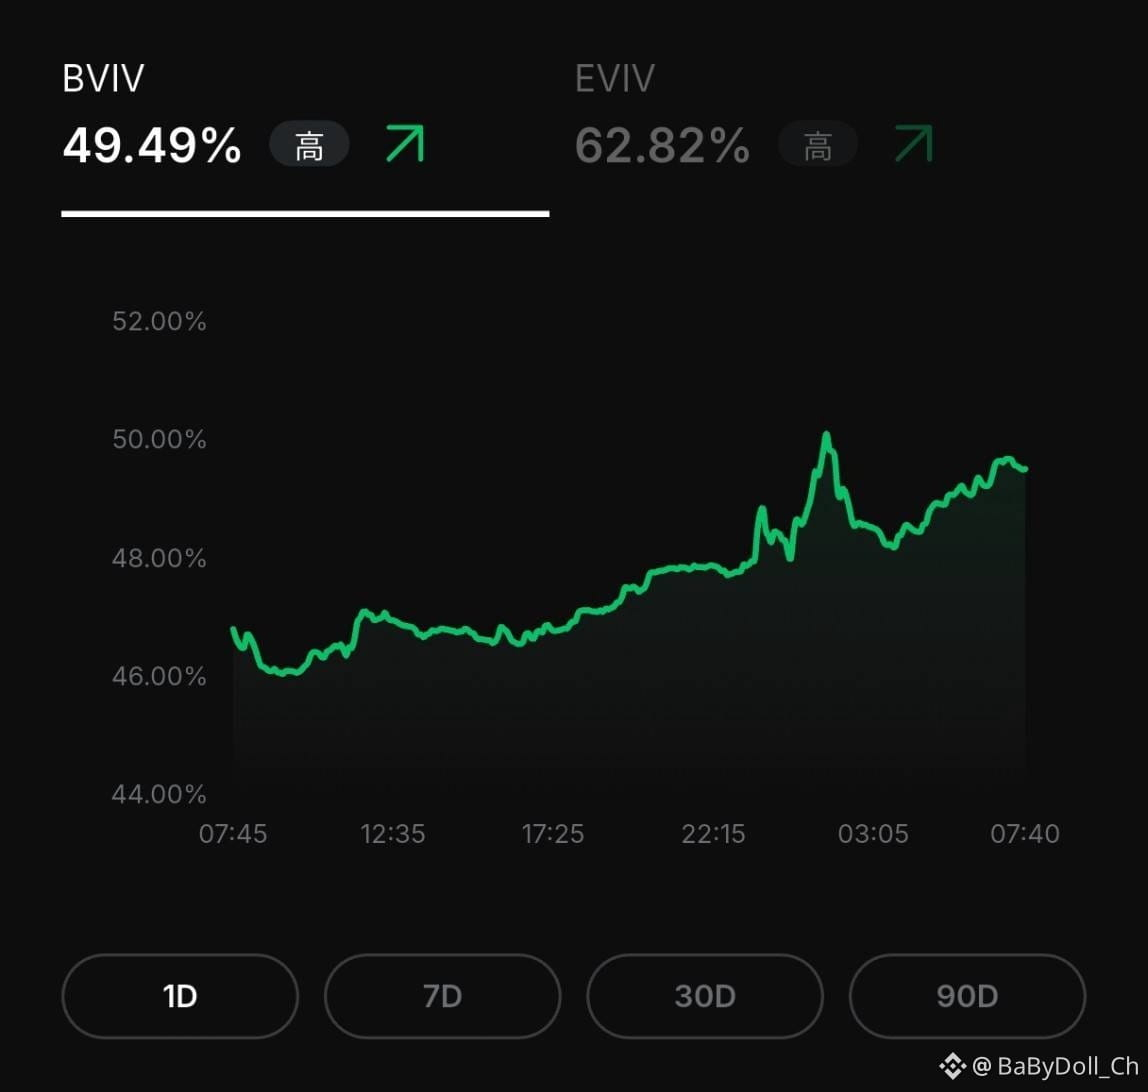
Bitcoin implied volatility (BVIV) has risen into the upper 40s, approaching 50%, indicating higher expected volatility.
Rising implied volatility reflects expectations of larger price swings, though it does not predict their direction.
Falling implied volatility reflects lower expected volatility, but does not rule out a sudden increase in market activity.
The data site is currently unavailable, so today’s analysis does not include a comparison between realized and implied volatility.
#BTC
#bitcoin
Here is a look at the current Bitcoin market.
Hedging demand is concentrated around $60,000–$64,000.
The nearest overhead options wall is around $66,000, where upward price moves may encounter resistance.
$60,000 remains a key level to watch. A break below it could trigger additional selling through delta hedging by market makers.
The key gamma flip level is around $69,000, with BTC currently trading below it.
Below this level, larger price swings are a concern, and technical support and resistance levels may be less effective.
Reclaiming $70,000 and holding above it remains an important focus.
“BTC is currently in a regime where hedging flows from market makers may amplify price moves in either direction.” (Image 3)
Bitcoin implied volatility (BVIV) has risen into the upper 40s, approaching 50%, indicating higher expected volatility.
Rising implied volatility reflects expectations of larger price swings, though it does not predict their direction.
Falling implied volatility reflects lower expected volatility, but does not rule out a sudden increase in market activity.
The data site is currently unavailable, so today’s analysis does not include a comparison between realized and implied volatility.
#BTC
#bitcoin