
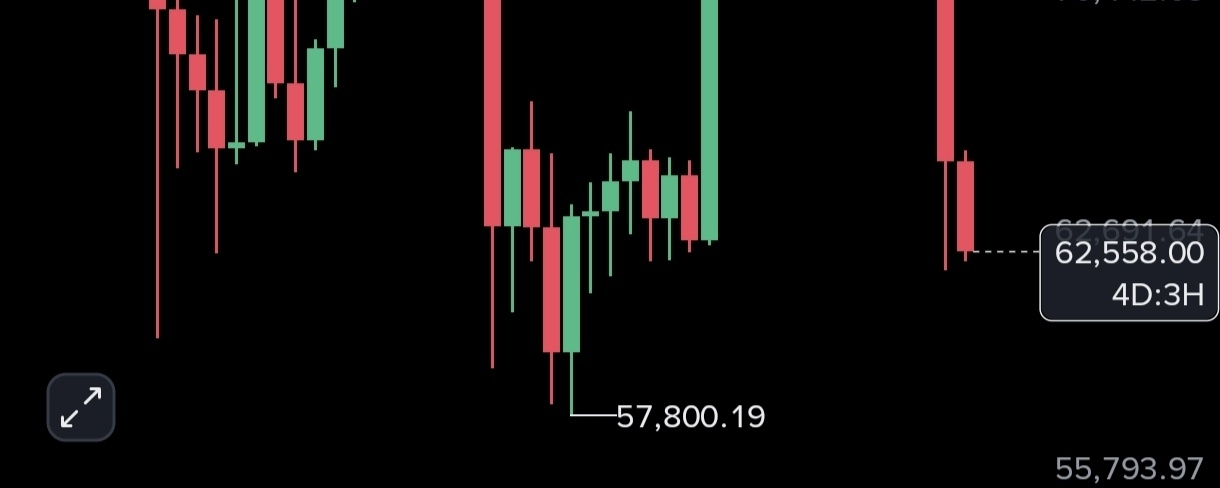

BTC is trading around $62,558 (-2.25%), and the weekly chart is showing serious selling pressure.
After falling from nearly $98K, Bitcoin has entered a major correction. But one thing deserves everyone's attention: RSI(6) has dropped to just 19.37!
📊 WHAT THE CHART IS TELLING US:
🔴 RSI(6): 19.37 – extremely oversold.
🔴 MACD: -1,204.95 – bearish momentum remains dominant.
🔴 DIF: -617.57.
🟢 Current price: $62,558.
🟢 24H low: $62,279.
🟢 Major historical support: $57,800.
🔴 Resistance: $70,442, followed by $79,150.
💎 MY TAKE:
Bitcoin is entering a zone that deserves serious attention from long-term SPOT investors.
If buyers defend $57.8K–$62K, a recovery attempt could develop. However, another weekly breakdown could bring additional downside pressure.
Remember: oversold doesn't mean the bottom is confirmed.
🔥 LET'S TALK:
If you had $500 to invest, would you start accumulating BTC around $62K, or wait for a possible $57K retest?
I want to hear the community's opinion! 👇