

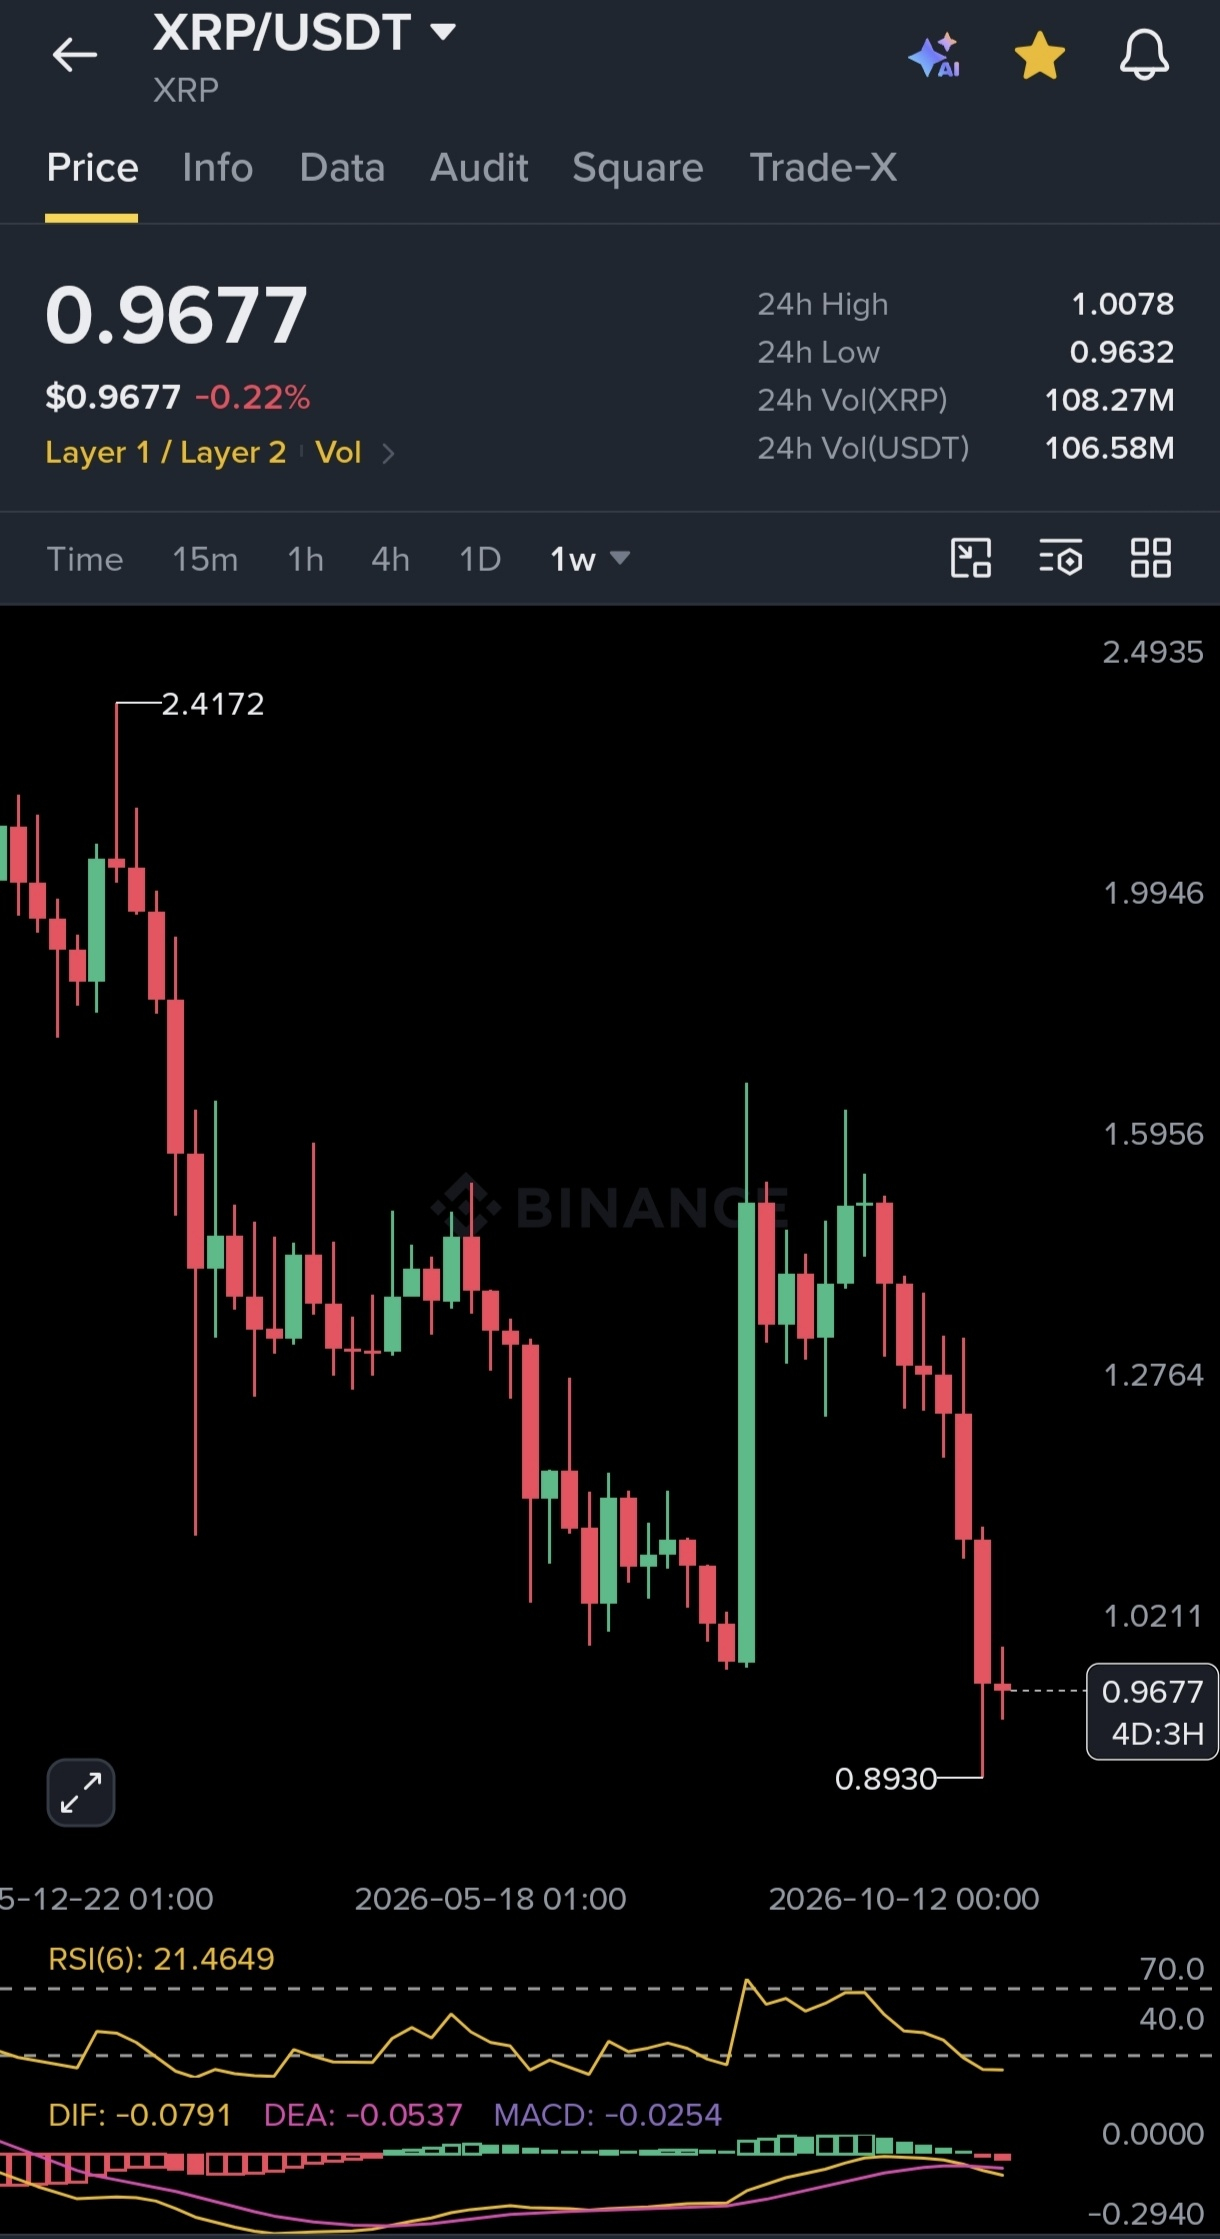
XRP is trading around $0.9677 (-0.22%), and the weekly chart is painting an interesting picture.
After a massive decline from $2.4172, XRP has returned below the psychological $1 level. But something deserves attention: RSI(6) is now at 21.46!
📊 WHAT THE CHART REVEALS:
🔴 RSI(6): 21.46 – deeply oversold.
🔴 MACD: -0.0254 – bearish momentum.
🔴 DIF: -0.0791.
🟢 Current price: $0.9677.
🟢 Recent weekly low: $0.8930.
🔴 Resistance: $1.0211, followed by $1.2764.
💎 MY TAKE:
XRP is entering an interesting zone for long-term SPOT watchers.
If buyers defend $0.8930, a recovery attempt could develop. Reclaiming $1.02 would be an important first sign of strength.
However, oversold doesn't automatically mean the bottom is in.
🔥 LET ME ASK YOU:
If XRP gives you another opportunity below $0.90, would you accumulate more or wait for a confirmed weekly reversal?