

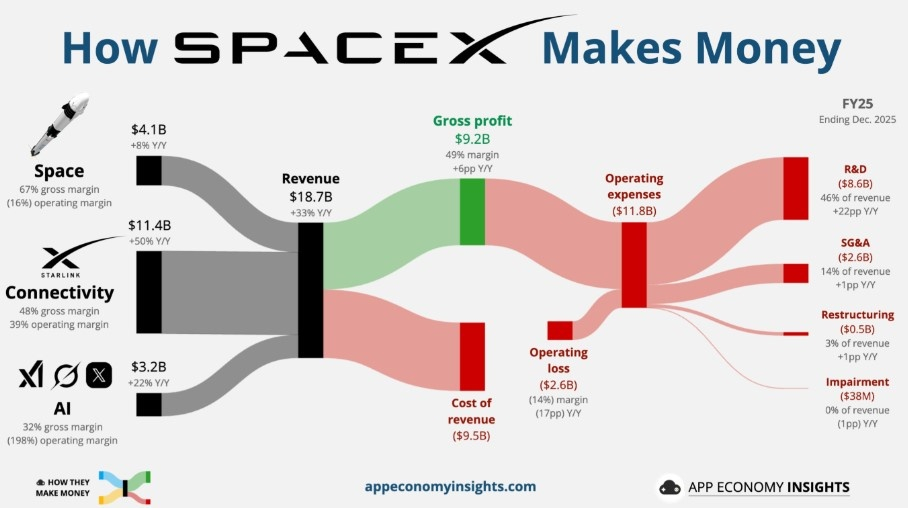
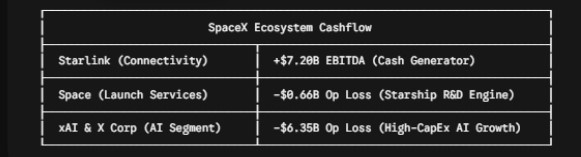
Beyond the headline revenues and high-level operating losses, SpaceX’s S-1 filing reveals a unique operational architecture where each of the three business segments plays a specific role in the broader corporate strategy.
Segment Operational Drivers & Deep Dive
1. Connectivity (Starlink): High-Margin Cash Generator
Customer Mix: The enterprise and government side ($4.18B revenue, +51% YoY) carries a zero-churn profile over the past two years among large enterprise clients paying >$750,000 annually.
ARPU vs. Scale: Consumer broadband ARPU compressed from $99/month (2023) to $81/month (2025) and $69/month (2026) as coverage expanded globally across lower-income regions. To mitigate this, SpaceX introduced a $5–$10 price increase across core markets to stabilize average revenue per user.
CapEx Efficiency: Satellite constellation buildouts cost $4.2 billion in 2025. High hardware margins (~63% EBITDA) allow Starlink to fund its own constellation replenishments while generating surplus cash for the parent entity.
2. Space (Launch Services): Internal Utility Platform
Internal Capacity Priority: Over 65% of Falcon 9 launches in 2025 and 2026 were deployed for internal Starlink V2/V3 satellites rather than external paying customers.
Starship R&D Expense: The reported operating loss of -$657 million in 2025 stems from expensing ~$3.0 billion in uncapitalized Starship R&D directly through the Space segment P&L.
Backlog Support: Commercial and government launch contracts maintain a solid revenue baseline ($2.58B commercial/NASA + $1.51B national security), anchored by high commercial launch market share.
3. xAI & X Corp: High-Burn Growth Infrastructure
Common-Control Accounting: Following the early-2026 consolidation under SpaceX, historical financial statements were recast to include both xAI and X Corp.
Infrastructure Depreciation: The -$6.35 billion operating loss is heavily driven by accelerated depreciation on hardware (such as compute clusters built with tens of thousands of GPUs) alongside massive $12.7 billion CapEx spending.
Revenue Anchor: While X advertising revenue contracted, external compute leasing (highlighted by a $1.25B/month multi-year compute deal with Anthropic) provides a key revenue floor to offset hardware depreciation costs.
Key Financial Takeaways
Internal Cross-Subsidization: Starlink’s $7.2B EBITDA at 63% margins absorbs the operational losses of both launch development and AI compute buildouts.
Total Capital Outflow: Total 2025 CapEx reached $20.70 billion against $6.8 billion in operating cash flow. The resulting $14 billion cash deficit was funded through private placements and institutional debt before the June IPO.