$NEAR / USDT
Current Price:
$3.240 = Rs 895.98
+2.34% green
24 Hours Data:
24h High: $3.430
24h Low: $3.164
24h Volume: 23.56M NEAR = $77.93M
What the chart is showing:
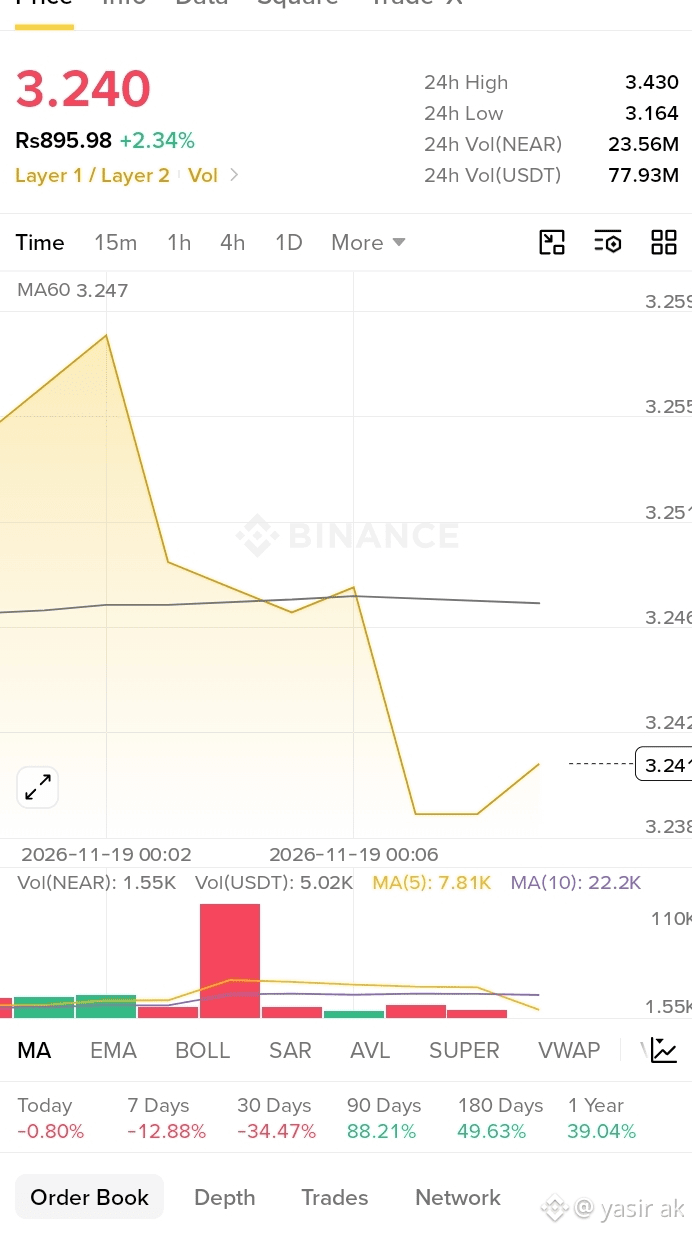
Price was high at ∼$3.259, then it dumped hard in two steps first to ∼$3.247, then again straight down to ∼$3.238.
Now it is trying to bounce a little back to $3.241.
The black line is MA60 = 3.247. Price is below MA60 right now. That is a small bearish sign. Price is struggling to go back above that average.
The big red bar at the bottom is volume that dump happened with big selling volume. After that, volume is very low, so market is quiet now.
Bottom performance mixed:
Today: -0.80%red
7 Days: -12.88% red
30 Days: -34.47%big red
90 Days: +88.21%big green
180 Days: +49.63%green
1 Year: +39.04%green
So NEAR is very strong in long-term (up 39% in 1 year, up 88% in 90 days), but in short-term it is correcting down 34% in 30 days.
In short:
NEAR pumped a lot in last 3 months, now it is taking a correction. It is at $3.24, below MA60 ($3.247). If it goes back above $3.247, it can try $3.43 again. If it stays below, it can fall to $3.164 (today's low).
#CanNvidia’sDataCenterGrowthContinue?
Current Price:
$3.240 = Rs 895.98
+2.34% green
24 Hours Data:
24h High: $3.430
24h Low: $3.164
24h Volume: 23.56M NEAR = $77.93M
What the chart is showing:
Price was high at ∼$3.259, then it dumped hard in two steps first to ∼$3.247, then again straight down to ∼$3.238.
Now it is trying to bounce a little back to $3.241.
The black line is MA60 = 3.247. Price is below MA60 right now. That is a small bearish sign. Price is struggling to go back above that average.
The big red bar at the bottom is volume that dump happened with big selling volume. After that, volume is very low, so market is quiet now.
Bottom performance mixed:
Today: -0.80%red
7 Days: -12.88% red
30 Days: -34.47%big red
90 Days: +88.21%big green
180 Days: +49.63%green
1 Year: +39.04%green
So NEAR is very strong in long-term (up 39% in 1 year, up 88% in 90 days), but in short-term it is correcting down 34% in 30 days.
In short:
NEAR pumped a lot in last 3 months, now it is taking a correction. It is at $3.24, below MA60 ($3.247). If it goes back above $3.247, it can try $3.43 again. If it stays below, it can fall to $3.164 (today's low).
#CanNvidia’sDataCenterGrowthContinue?