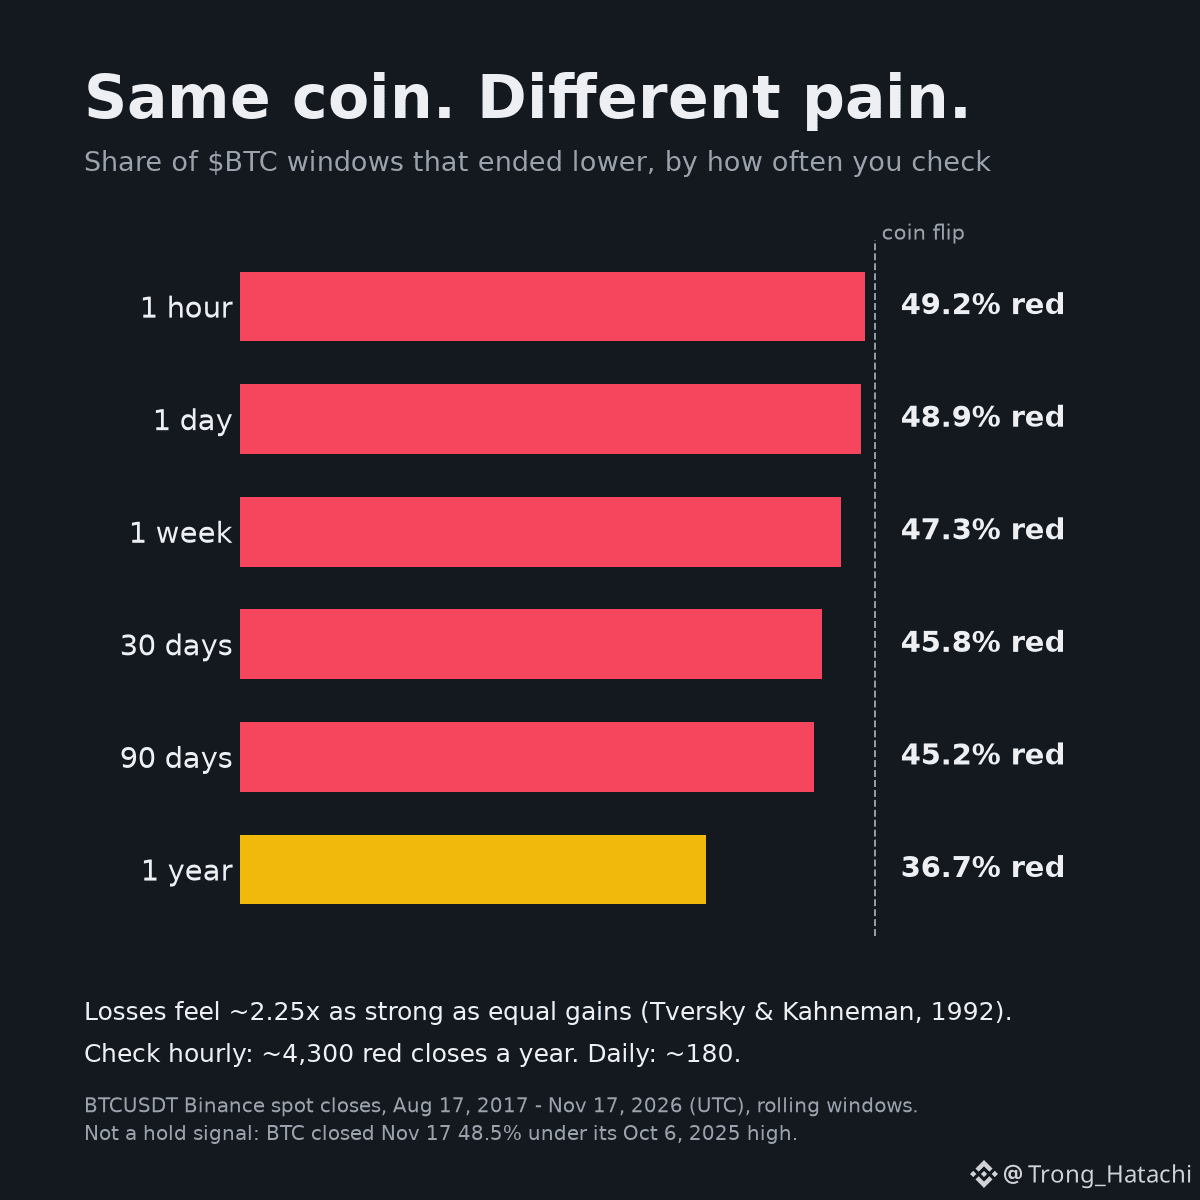
Checked $BTC every hour since 2017? 49.2% of those hours closed red.
Checked it once a year instead? 36.7% red.
Same coin, same 9 years. Only the checking changed.
Source: Binance $BTC closes, Aug 2017-Nov 2026. Share of windows that ended red:
1 hour: 49.2%
1 day: 48.9%
30 days: 45.8%
1 year: 36.7%
Why that hurts: losses feel about 2.25x as strong as equal gains (Tversky & Kahneman, 1992). Check hourly and that's ~4,300 red closes a year. Each one stings, even when the plan is fine. Benartzi & Thaler (1995): myopic loss aversion.
This is not "just HODL." Over 1 in 3 yearly windows still lost money, and $BTC closed Nov 17 48.5% under its Oct 2025 high.
What helps:
1. Check on the timeframe you trade. Daily setup = 1 look per daily close, not 24
2. Set alerts at your SL and TP, then close the app
3. Size so one red day can't make you rewrite the plan
How often do you open the chart: HOURLY or DAILY? 👇
#TradingPsychology #CryptoTrading #Bitcoin $BTC
Not financial advice.
Checked it once a year instead? 36.7% red.
Same coin, same 9 years. Only the checking changed.
Source: Binance $BTC closes, Aug 2017-Nov 2026. Share of windows that ended red:
1 hour: 49.2%
1 day: 48.9%
30 days: 45.8%
1 year: 36.7%
Why that hurts: losses feel about 2.25x as strong as equal gains (Tversky & Kahneman, 1992). Check hourly and that's ~4,300 red closes a year. Each one stings, even when the plan is fine. Benartzi & Thaler (1995): myopic loss aversion.
This is not "just HODL." Over 1 in 3 yearly windows still lost money, and $BTC closed Nov 17 48.5% under its Oct 2025 high.
What helps:
1. Check on the timeframe you trade. Daily setup = 1 look per daily close, not 24
2. Set alerts at your SL and TP, then close the app
3. Size so one red day can't make you rewrite the plan
How often do you open the chart: HOURLY or DAILY? 👇
#TradingPsychology #CryptoTrading #Bitcoin $BTC
Not financial advice.