$XUSD: Quiet Absorption: When Volume Speaks Softly
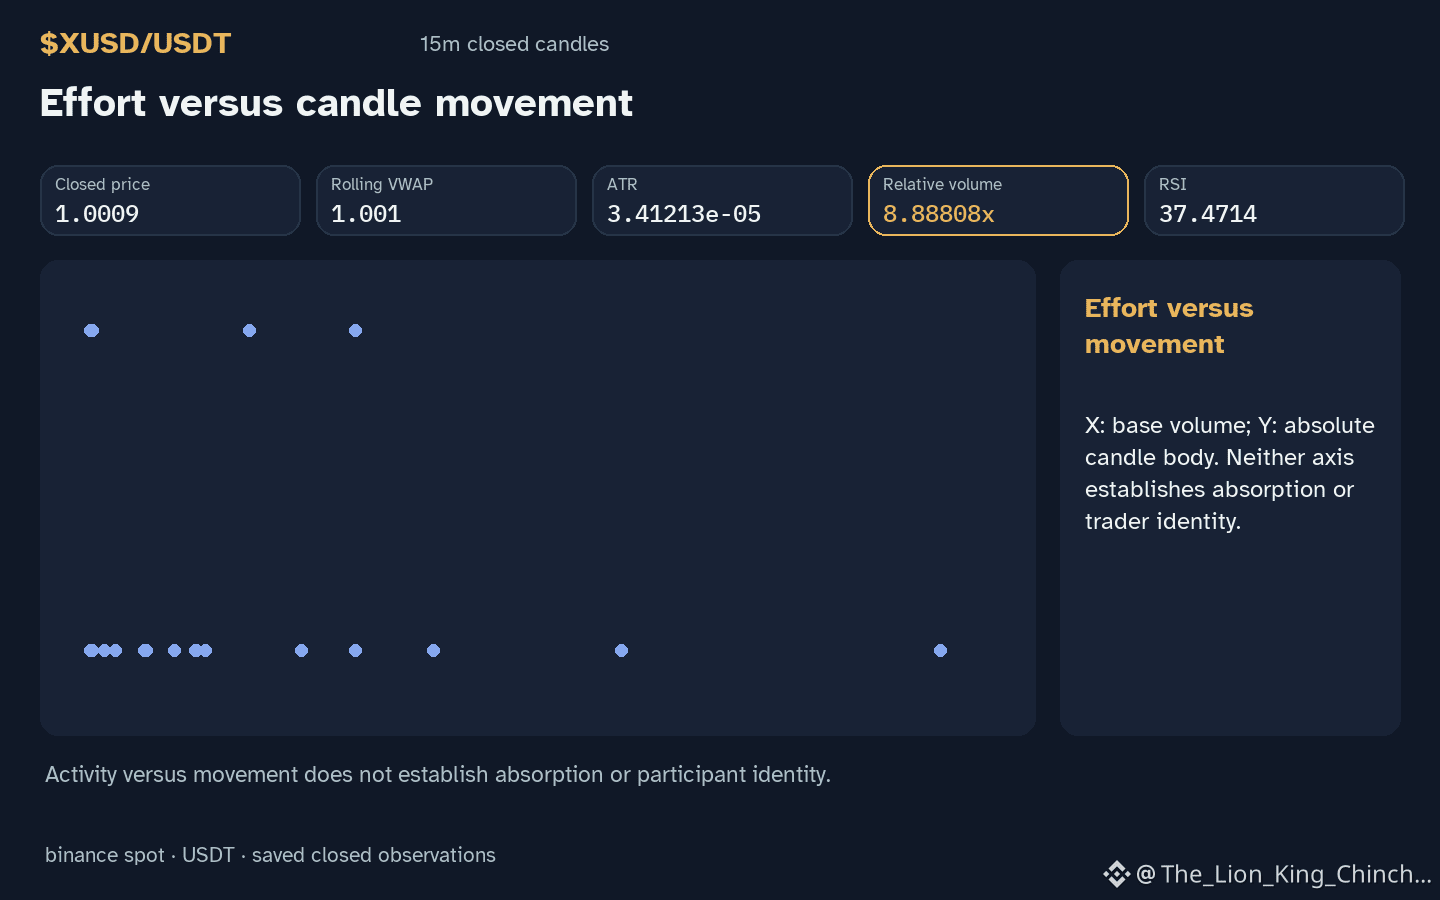
Why does $XUSD show a down hourly direction while volume sits above baseline? The observation raises a question about hidden market dynamics that are not obvious from price alone. Imagine a sponge soaking up water: the surface may appear dry, yet the interior holds liquid that will later influence the overall weight. In crypto markets, volume can act like that sponge, absorbing buying or selling pressure without immediate price movement. When relative volume reaches 8.89x baseline, the market may be quietly accumulating positions, similar to a slow‑fill bathtub where the water level rises imperceptibly.
A useful way to test this idea is to compare the price change and momentum indicator. An hourly change of -0.00999001% paired with RSI 37.5 suggests the price is moving modestly while the momentum gauge remains neutral, supporting the sponge analogy. However, the analogy breaks if price swings sharply despite high volume, indicating that the market is not merely absorbing but actively redistributing liquidity. A counterexample would be a rapid price drop with the same volume level, which would refute the quiet‑absorption hypothesis.
To reassess, watch the next closed hourly candle: if the price resumes a similar direction with unchanged relative volume, the sponge model gains credibility; if the price spikes or crashes, the hypothesis weakens. This conditional check keeps the analysis grounded in observable data without asserting hidden motives.
Probabilistic market research, not a recommendation or guaranteed return.
#XUSD
Why does $XUSD show a down hourly direction while volume sits above baseline? The observation raises a question about hidden market dynamics that are not obvious from price alone. Imagine a sponge soaking up water: the surface may appear dry, yet the interior holds liquid that will later influence the overall weight. In crypto markets, volume can act like that sponge, absorbing buying or selling pressure without immediate price movement. When relative volume reaches 8.89x baseline, the market may be quietly accumulating positions, similar to a slow‑fill bathtub where the water level rises imperceptibly.
A useful way to test this idea is to compare the price change and momentum indicator. An hourly change of -0.00999001% paired with RSI 37.5 suggests the price is moving modestly while the momentum gauge remains neutral, supporting the sponge analogy. However, the analogy breaks if price swings sharply despite high volume, indicating that the market is not merely absorbing but actively redistributing liquidity. A counterexample would be a rapid price drop with the same volume level, which would refute the quiet‑absorption hypothesis.
To reassess, watch the next closed hourly candle: if the price resumes a similar direction with unchanged relative volume, the sponge model gains credibility; if the price spikes or crashes, the hypothesis weakens. This conditional check keeps the analysis grounded in observable data without asserting hidden motives.
Probabilistic market research, not a recommendation or guaranteed return.
#XUSD