$BTC Bitcoin (BTC) – Today's Market Analysis
I'll focus on the latest BTC price action, key support and resistance levels, and whether Bitcoin is showing bullish or bearish momentum.
Bitcoin (BTC/USD)
Bitcoin today latest chart
Bitcoin (BTC) – Today's Market Analysis
I'll focus on the latest BTC price action, key support and resistance levels, and whether Bitcoin is showing bullish or bearish momentum.
$BTC
Bitcoin (BTC/USD)
Bearish trend
$64,700
Approximate live market level · November 18, 2026
Daily BTC closing prices, November 8–17, 2026. November 18 is still in progress.
Nov 14
BTC price
$64.2K
$63K
$66.5K
$70K
$73.5K
$77K
Nov 8
Nov 10
Nov 13
Nov 15
Nov 17
Nov 8: BTC price $74.9K
Nov 9: BTC price $75.4K
Nov 10: BTC price $73.8K
Nov 11: BTC price $74K
Nov 12: BTC price $71.5K
Nov 13: BTC price $68.3K
Nov 14: BTC price $64.2K
Nov 15: BTC price $65.4K
Nov 16: BTC price $64.9K
Nov 17: BTC price $64.9K
Important technical levels
$BTC
Level
Price
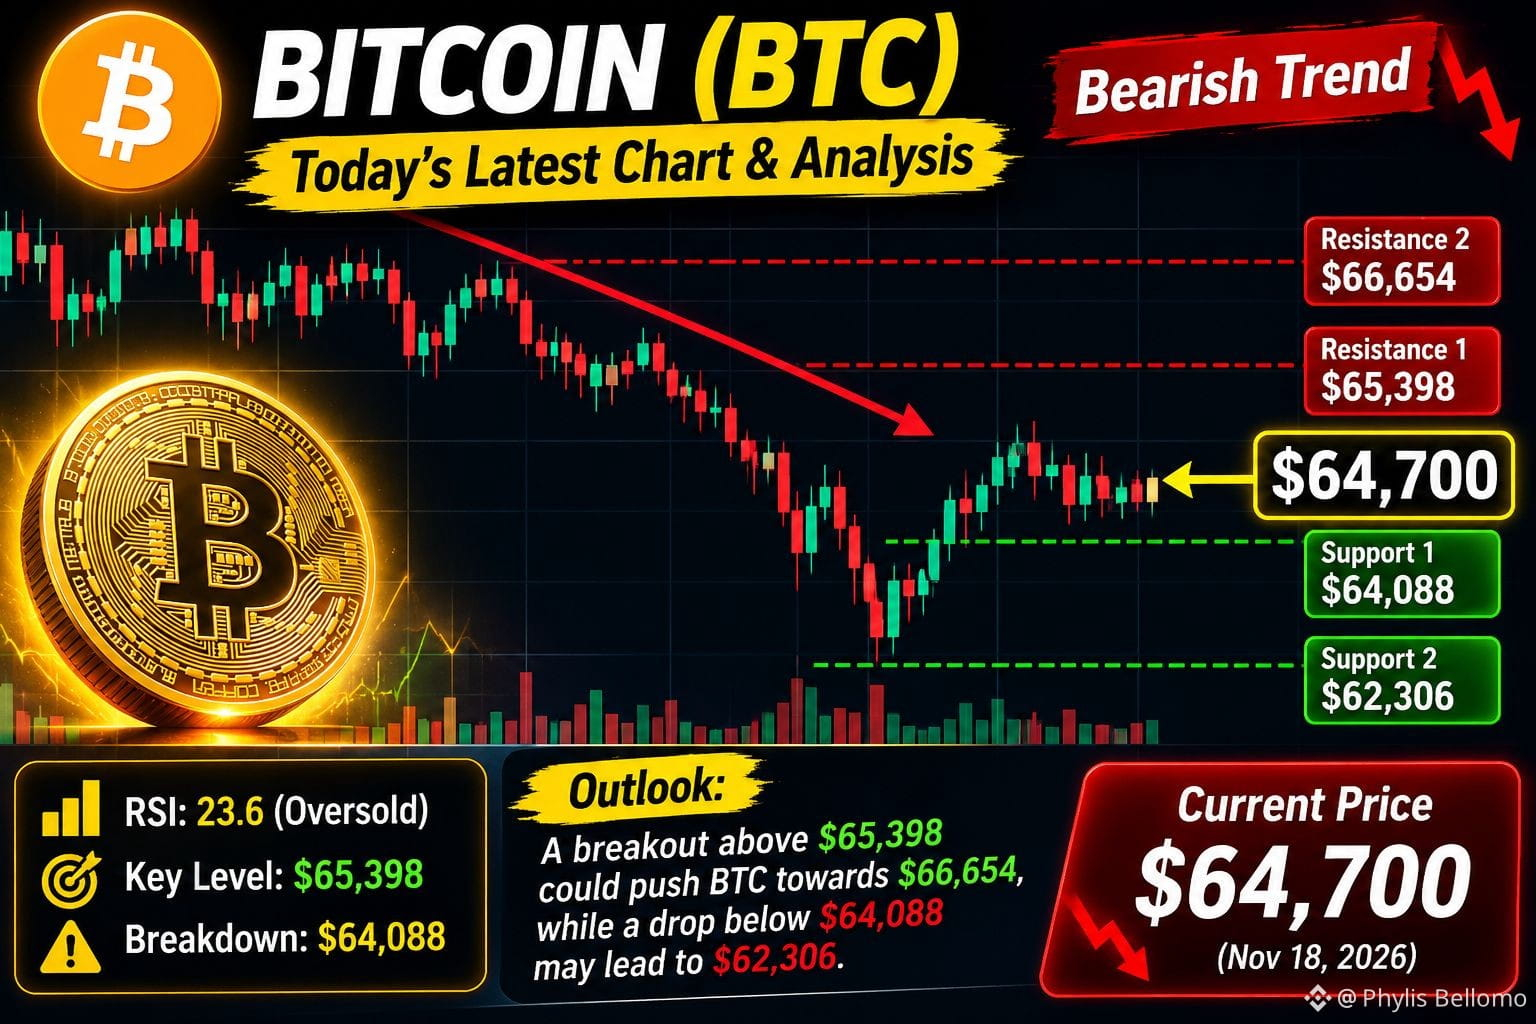
Resistance 2
$66,654
Resistance 1
$65,398
Support 1
$64,088
Support 2
$62,306
Today's outlook
Bearish momentum remains dominant.
RSI is around 23.6, indicating oversold conditions.
A breakout above $65,398 could support a recovery toward $66,654.
A breakdown below $64,088 could expose $62,306.
#bitcoin.” #BitEagleNews
I'll focus on the latest BTC price action, key support and resistance levels, and whether Bitcoin is showing bullish or bearish momentum.
Bitcoin (BTC/USD)
Bitcoin today latest chart
Bitcoin (BTC) – Today's Market Analysis
I'll focus on the latest BTC price action, key support and resistance levels, and whether Bitcoin is showing bullish or bearish momentum.
$BTC
Bitcoin (BTC/USD)
Bearish trend
$64,700
Approximate live market level · November 18, 2026
Daily BTC closing prices, November 8–17, 2026. November 18 is still in progress.
Nov 14
BTC price
$64.2K
$63K
$66.5K
$70K
$73.5K
$77K
Nov 8
Nov 10
Nov 13
Nov 15
Nov 17
Nov 8: BTC price $74.9K
Nov 9: BTC price $75.4K
Nov 10: BTC price $73.8K
Nov 11: BTC price $74K
Nov 12: BTC price $71.5K
Nov 13: BTC price $68.3K
Nov 14: BTC price $64.2K
Nov 15: BTC price $65.4K
Nov 16: BTC price $64.9K
Nov 17: BTC price $64.9K
Important technical levels
$BTC
Level
Price
Resistance 2
$66,654
Resistance 1
$65,398
Support 1
$64,088
Support 2
$62,306
Today's outlook
Bearish momentum remains dominant.
RSI is around 23.6, indicating oversold conditions.
A breakout above $65,398 could support a recovery toward $66,654.
A breakdown below $64,088 could expose $62,306.
#bitcoin.” #BitEagleNews