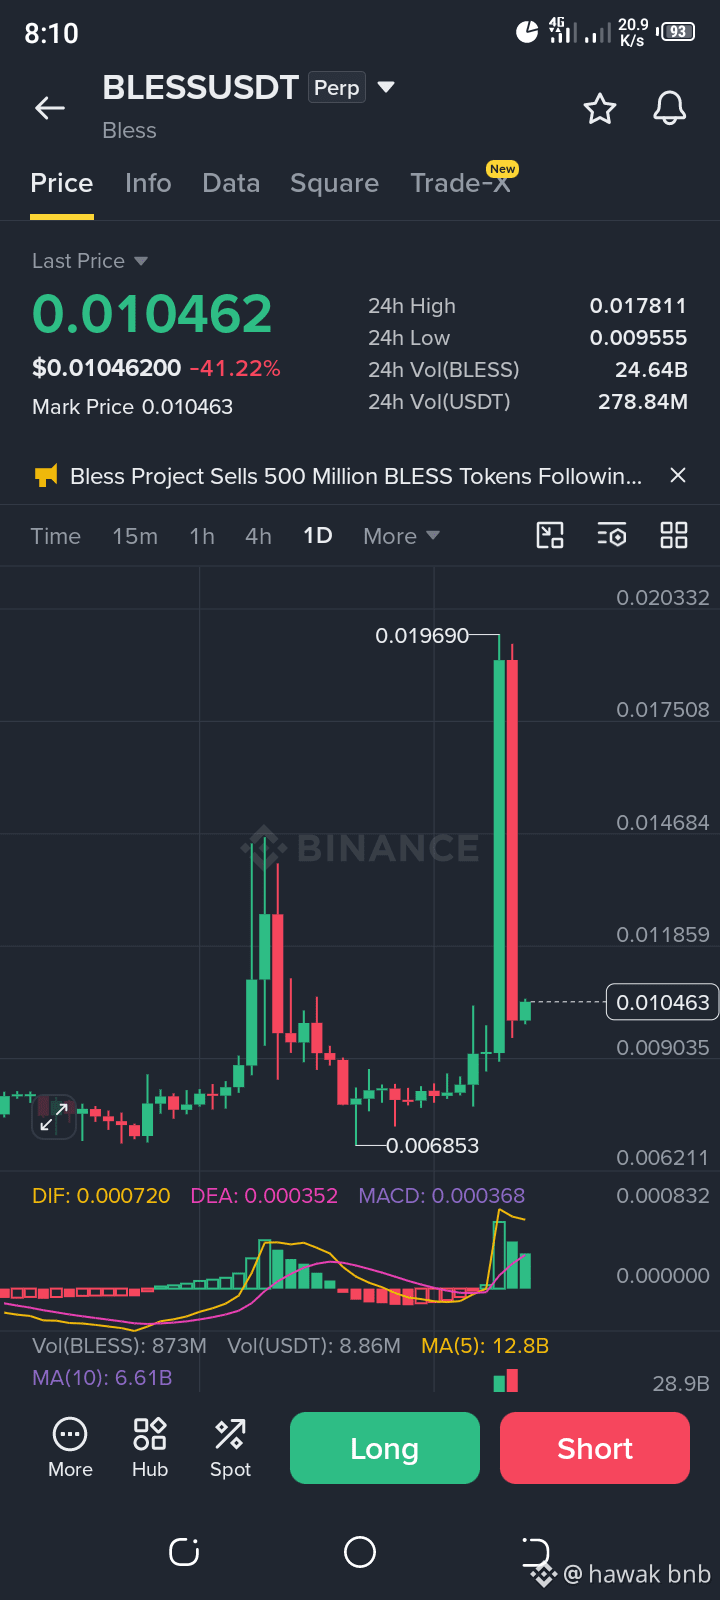
Over the past 24 hours, BLESS recorded a high of $0.017811 and a low of $0.009555. Market liquidity remains exceptionally heavy due to the sharp volatility, underscored by a 24-hour trading volume of 24.64B BLESS and 278.44M USDT. An announcement banner also highlights significant project activity, noting that the Bless Project sold 500 million BLESS tokens, which likely triggered the heavy supply-side pressure.
Technical Indicators (MACD & Moving Averages)
MACD: In the lower panel, the MACD indicator displays values of DIF: 0.000720, DEA: 0.000352, and MACD: 0.000368. While the indicator lines are still positioned near the zero threshold, the massive red reversal candle indicates a sudden shift toward short-term bearish dominance.
Volume Moving Averages: Volume moving averages show MA(5) at 12.8B compared to MA(10) at 6.61B, illustrating massive trading activity during this volatile pump-and-dump cycle. @Bless #BLESSUSDT $BLESS #CanNvidia’sDataCenterGrowthContinue? #NvidiaBoardNotConsideringHuang’sReturnasCEO #AnthropicClearedToListOnNasdaqAsANT #WhatInvestmentSignalsDo13FFilingsReveal?
Technical Indicators (MACD & Moving Averages)
MACD: In the lower panel, the MACD indicator displays values of DIF: 0.000720, DEA: 0.000352, and MACD: 0.000368. While the indicator lines are still positioned near the zero threshold, the massive red reversal candle indicates a sudden shift toward short-term bearish dominance.
Volume Moving Averages: Volume moving averages show MA(5) at 12.8B compared to MA(10) at 6.61B, illustrating massive trading activity during this volatile pump-and-dump cycle. @Bless #BLESSUSDT $BLESS #CanNvidia’sDataCenterGrowthContinue? #NvidiaBoardNotConsideringHuang’sReturnasCEO #AnthropicClearedToListOnNasdaqAsANT #WhatInvestmentSignalsDo13FFilingsReveal?