🚨 $MMT $MMT /USDT Technical Analysis: Symmetrical Triangle Compression & Impending Breakout Setup 📊
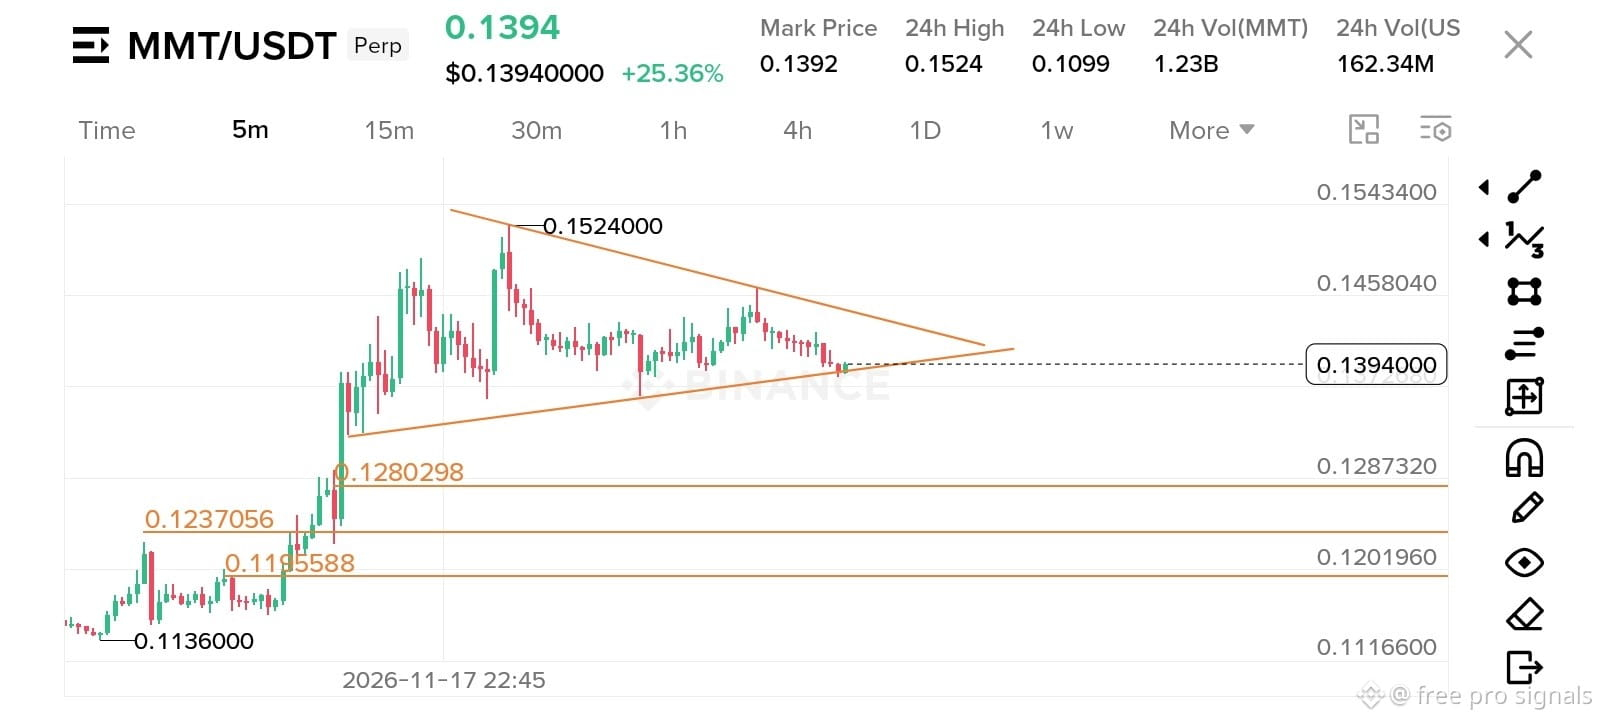
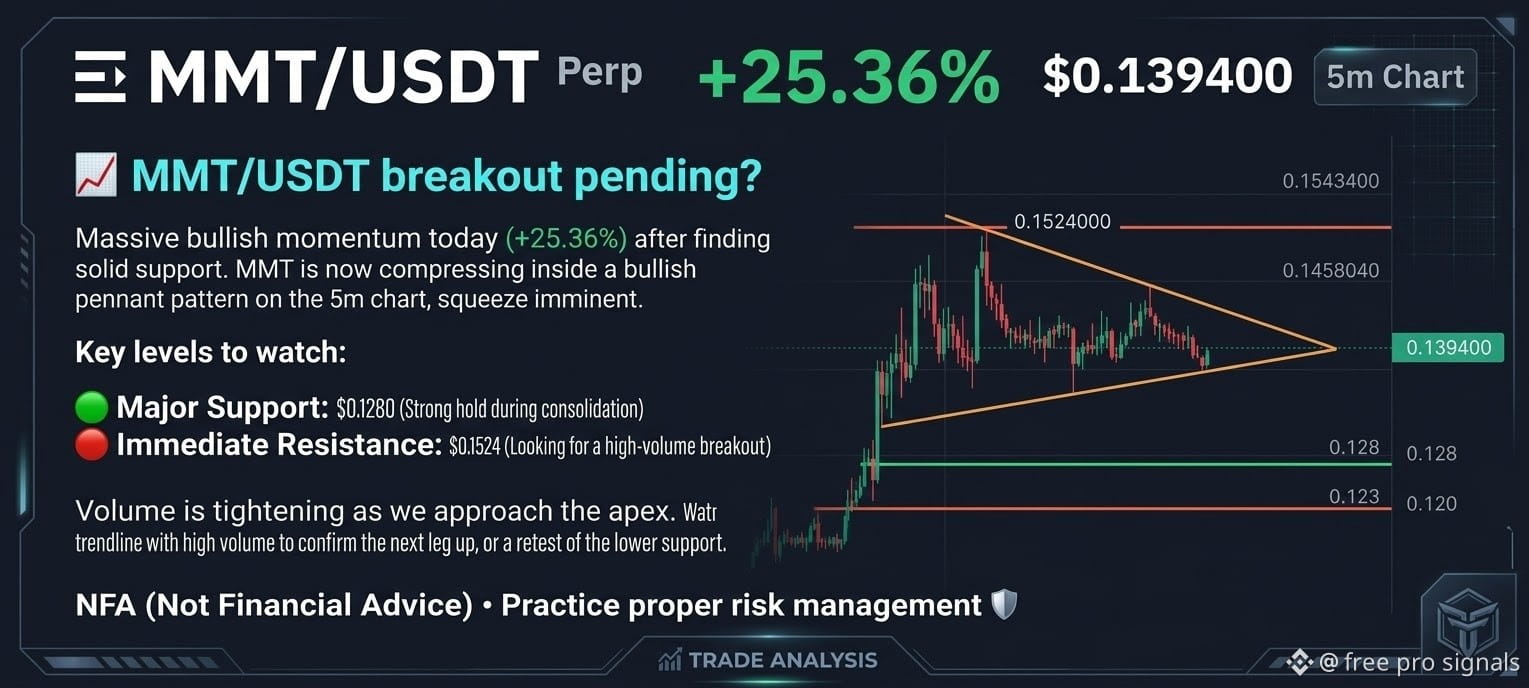
The MMT/USDT perpetual chart on the 15m timeframe is currently coiling inside a classic Symmetrical Triangle pattern. Price is compressing tightly around the $0.1394 mark after a strong impulsive rally from the $0.1136 low.
Volatility expansion is imminent. Here are the two potential institutional scenarios to play this breakout safely:
📉 Scenario A: Bearish Breakdown (Short Setup)
Trigger: A clean 15m candle close below the descending trendline support of the triangle.
Entry: Market price on retest or immediate continuation after confirmation close.
Take Profit Targets (TPs):
TP1: $0.1287
TP2: $0.1201
TP3: $0.1116
116
Stop Loss (SL): Placed safely just above the internal swing high / upper trendline boundary (around $0.1458).
📈 Scenario B: Bullish Breakout (Long Setup)
Trigger: A clean 15m candle close above the upper resistance trendline of the triangle.
Entry: On a confirmed breakout candle close or a healthy retest of the broken trendline.
Take Profit Targets (TPs):
TP1: $0.1458
TP2: $0.1524 (Major local high retest)
TP3: $0.1543
543
Stop Loss (SL): Placed below the structural pivot point / mid-range support (around $0.1340).
💡 Professional Risk Management Advice
Wait for Confirmation: Avoid trading inside the apex. Always wait for a confirmed candle close outside the triangle boundaries to avoid fakeouts.
Leverage & Position Sizing: Keep leverage low (2x–3x max) given current market volatility, and secure partial profits at TP1 while moving your stop loss to breakeven.
Disclaimer: Crypto trading involves high risk. Always manage your risk and do your own research (DYOR) before executing any trades.
$MMT
What is your bias on MMT? Are you leaning towards a breakdown or a bullish continuation? Drop your thoughts below! 👇
#BinanceSquare #CryptoTrading. #MMT #TechnicalAnalysis #WhatInvestmentSignalsDo13FFilingsReveal?
The MMT/USDT perpetual chart on the 15m timeframe is currently coiling inside a classic Symmetrical Triangle pattern. Price is compressing tightly around the $0.1394 mark after a strong impulsive rally from the $0.1136 low.
Volatility expansion is imminent. Here are the two potential institutional scenarios to play this breakout safely:
📉 Scenario A: Bearish Breakdown (Short Setup)
Trigger: A clean 15m candle close below the descending trendline support of the triangle.
Entry: Market price on retest or immediate continuation after confirmation close.
Take Profit Targets (TPs):
TP1: $0.1287
TP2: $0.1201
TP3: $0.1116
116
Stop Loss (SL): Placed safely just above the internal swing high / upper trendline boundary (around $0.1458).
📈 Scenario B: Bullish Breakout (Long Setup)
Trigger: A clean 15m candle close above the upper resistance trendline of the triangle.
Entry: On a confirmed breakout candle close or a healthy retest of the broken trendline.
Take Profit Targets (TPs):
TP1: $0.1458
TP2: $0.1524 (Major local high retest)
TP3: $0.1543
543
Stop Loss (SL): Placed below the structural pivot point / mid-range support (around $0.1340).
💡 Professional Risk Management Advice
Wait for Confirmation: Avoid trading inside the apex. Always wait for a confirmed candle close outside the triangle boundaries to avoid fakeouts.
Leverage & Position Sizing: Keep leverage low (2x–3x max) given current market volatility, and secure partial profits at TP1 while moving your stop loss to breakeven.
Disclaimer: Crypto trading involves high risk. Always manage your risk and do your own research (DYOR) before executing any trades.
$MMT
What is your bias on MMT? Are you leaning towards a breakdown or a bullish continuation? Drop your thoughts below! 👇
#BinanceSquare #CryptoTrading. #MMT #TechnicalAnalysis #WhatInvestmentSignalsDo13FFilingsReveal?