$BTC 1H TECHNICAL STRUCTURE CHECK 👀
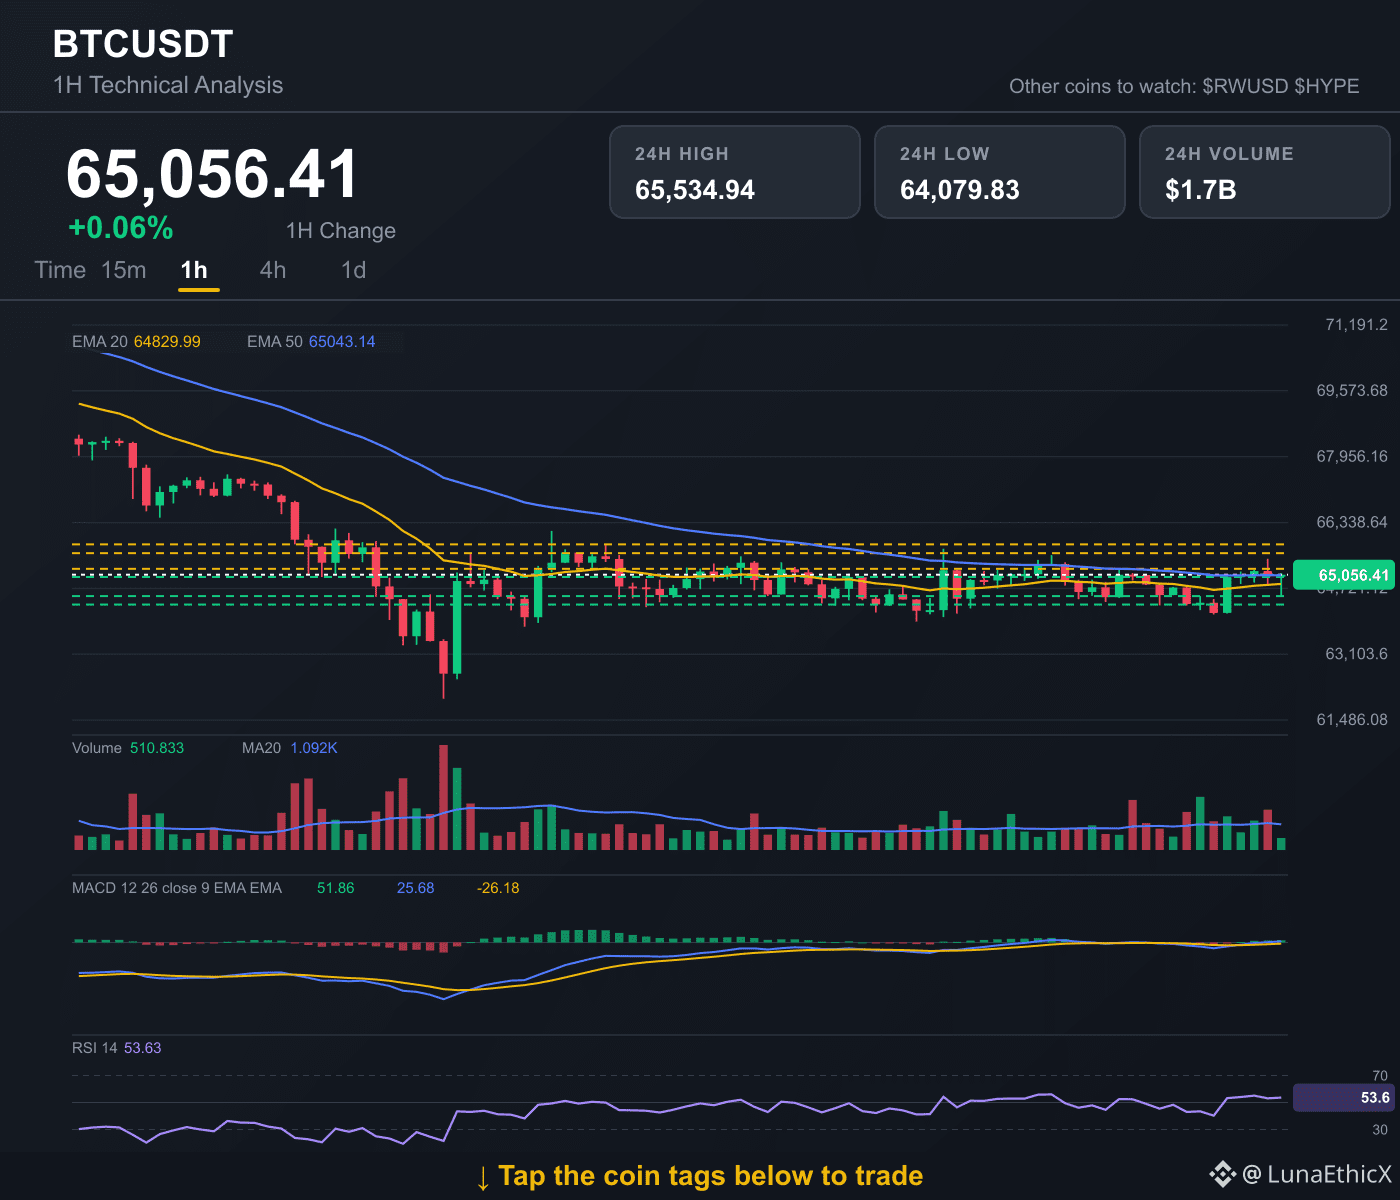
At 65056.41, the relationship with EMA20 64829.9878 and EMA50 65043.136 keeps the technical structure mixed. RSI at 53.63 is neutral, with MACD 25.68303 and signal -26.179 providing the next momentum clue, with histogram momentum strengthening. The chart faces potential barriers at 65200, 65583.9325 and 65800.75. Three downside levels to monitor are 65000, 64530.12 and 64321.82.
$RWUSD and $HYPE remain separate charts worth monitoring. 👀
💰 Your next market check could start below. Tap a coin to explore.
#TechnicalAnalysis #CryptoAnalysis #BinanceSquare
$BTC $RWUSD $HYPE
At 65056.41, the relationship with EMA20 64829.9878 and EMA50 65043.136 keeps the technical structure mixed. RSI at 53.63 is neutral, with MACD 25.68303 and signal -26.179 providing the next momentum clue, with histogram momentum strengthening. The chart faces potential barriers at 65200, 65583.9325 and 65800.75. Three downside levels to monitor are 65000, 64530.12 and 64321.82.
$RWUSD and $HYPE remain separate charts worth monitoring. 👀
💰 Your next market check could start below. Tap a coin to explore.
#TechnicalAnalysis #CryptoAnalysis #BinanceSquare
$BTC $RWUSD $HYPE