AGT (Alaya Governance Token) Builds a Quiet Base: Slow Recovery Still Facing a Big Test
AGT is putting together a steady, low-drama recovery. It’s trading at $0.026548, up 10.85% over the last 24 hours, and the chart shows a patient climb rather than a sudden spike.
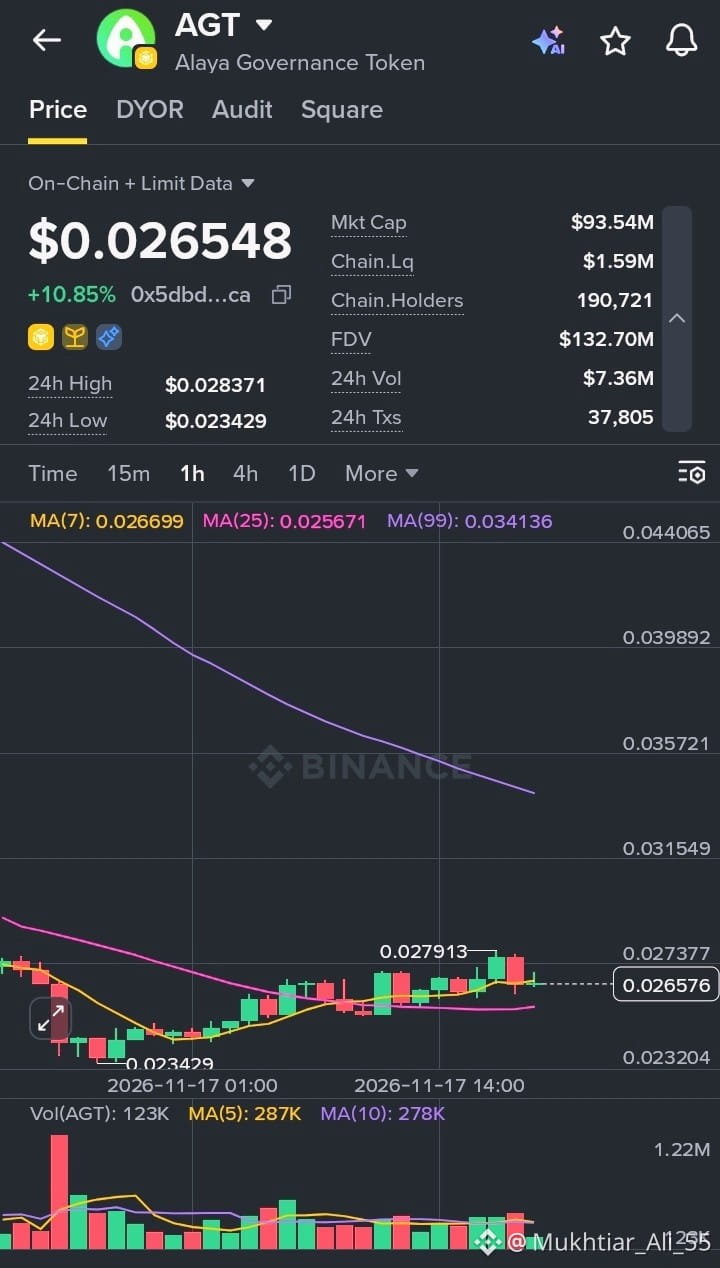
Price bottomed near $0.02343 earlier in the session and has been grinding higher ever since, forming a gentle series of higher lows. The recent high sits around $0.02791, and the 24h range of $0.023429 to $0.028371 shows price is now trading in the upper half of its daily band. On the 1H chart, price is hovering right around the MA(7) at 0.026699 and holding above the MA(25) at 0.025671, which is a constructive sign after the earlier slide.
The bigger picture needs some respect, though. The MA(99) at 0.034136 is still sloping sharply downward and sits well above current price, so the longer-term trend has not turned yet. This bounce is a recovery within a larger downtrend until proven otherwise.
Key numbers at a glance:
Market Cap: $93.54M
FDV: $132.70M
24h Range: $0.023429 – $0.028371
24h Volume: $7.36M across 37,805 transactions
On-chain holders: 190,721
Chain liquidity: $1.59M
The holder count stands out here. Over 190K holders is a large community for a token of this size, which points to a wide and engaged base. Volume was heaviest during the early selloff and has stayed fairly even since, so the recovery has been gradual rather than driven by a burst of buying. Liquidity of $1.59M against a $93.54M market cap does mean larger orders can move price quickly, so volatility should be expected.
The levels to watch are the $0.0279 to $0.0284 zone on the upside, where a clean break would signal real momentum, and the MA(25) near 0.0257 on the downside, which has been acting as support. As long as that floor holds, buyers remain in control of the short-term structure.
#AGT #AlayaGovernanceToken #CryptoAnalysis #AltcoinWatch #TechnicalAnalysis
$AGT
AGT is putting together a steady, low-drama recovery. It’s trading at $0.026548, up 10.85% over the last 24 hours, and the chart shows a patient climb rather than a sudden spike.
Price bottomed near $0.02343 earlier in the session and has been grinding higher ever since, forming a gentle series of higher lows. The recent high sits around $0.02791, and the 24h range of $0.023429 to $0.028371 shows price is now trading in the upper half of its daily band. On the 1H chart, price is hovering right around the MA(7) at 0.026699 and holding above the MA(25) at 0.025671, which is a constructive sign after the earlier slide.
The bigger picture needs some respect, though. The MA(99) at 0.034136 is still sloping sharply downward and sits well above current price, so the longer-term trend has not turned yet. This bounce is a recovery within a larger downtrend until proven otherwise.
Key numbers at a glance:
Market Cap: $93.54M
FDV: $132.70M
24h Range: $0.023429 – $0.028371
24h Volume: $7.36M across 37,805 transactions
On-chain holders: 190,721
Chain liquidity: $1.59M
The holder count stands out here. Over 190K holders is a large community for a token of this size, which points to a wide and engaged base. Volume was heaviest during the early selloff and has stayed fairly even since, so the recovery has been gradual rather than driven by a burst of buying. Liquidity of $1.59M against a $93.54M market cap does mean larger orders can move price quickly, so volatility should be expected.
The levels to watch are the $0.0279 to $0.0284 zone on the upside, where a clean break would signal real momentum, and the MA(25) near 0.0257 on the downside, which has been acting as support. As long as that floor holds, buyers remain in control of the short-term structure.
#AGT #AlayaGovernanceToken #CryptoAnalysis #AltcoinWatch #TechnicalAnalysis
$AGT