🔴 $SNDK /USDT · Bias: SHORT
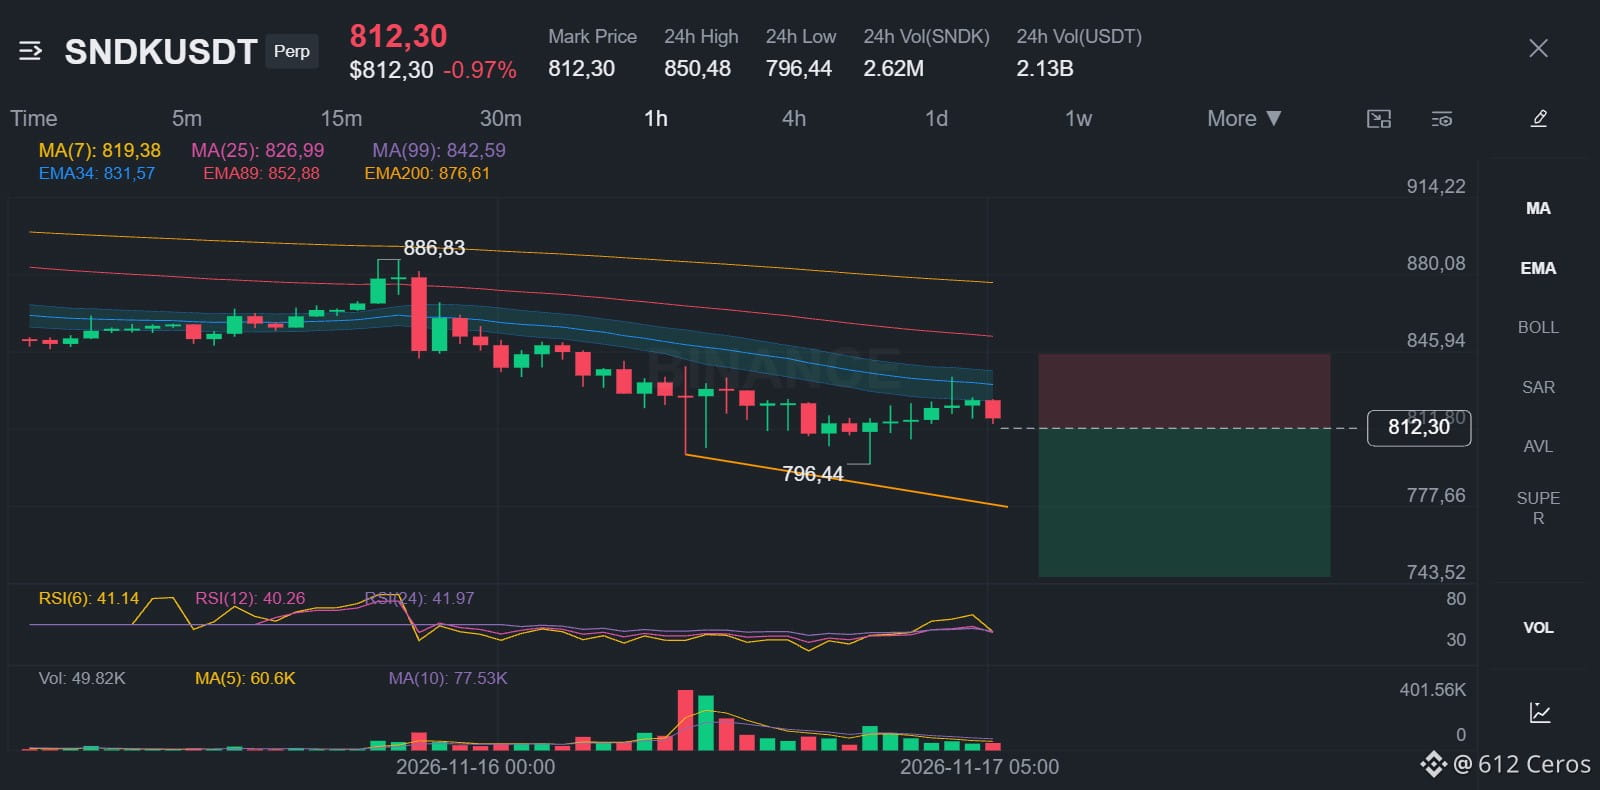
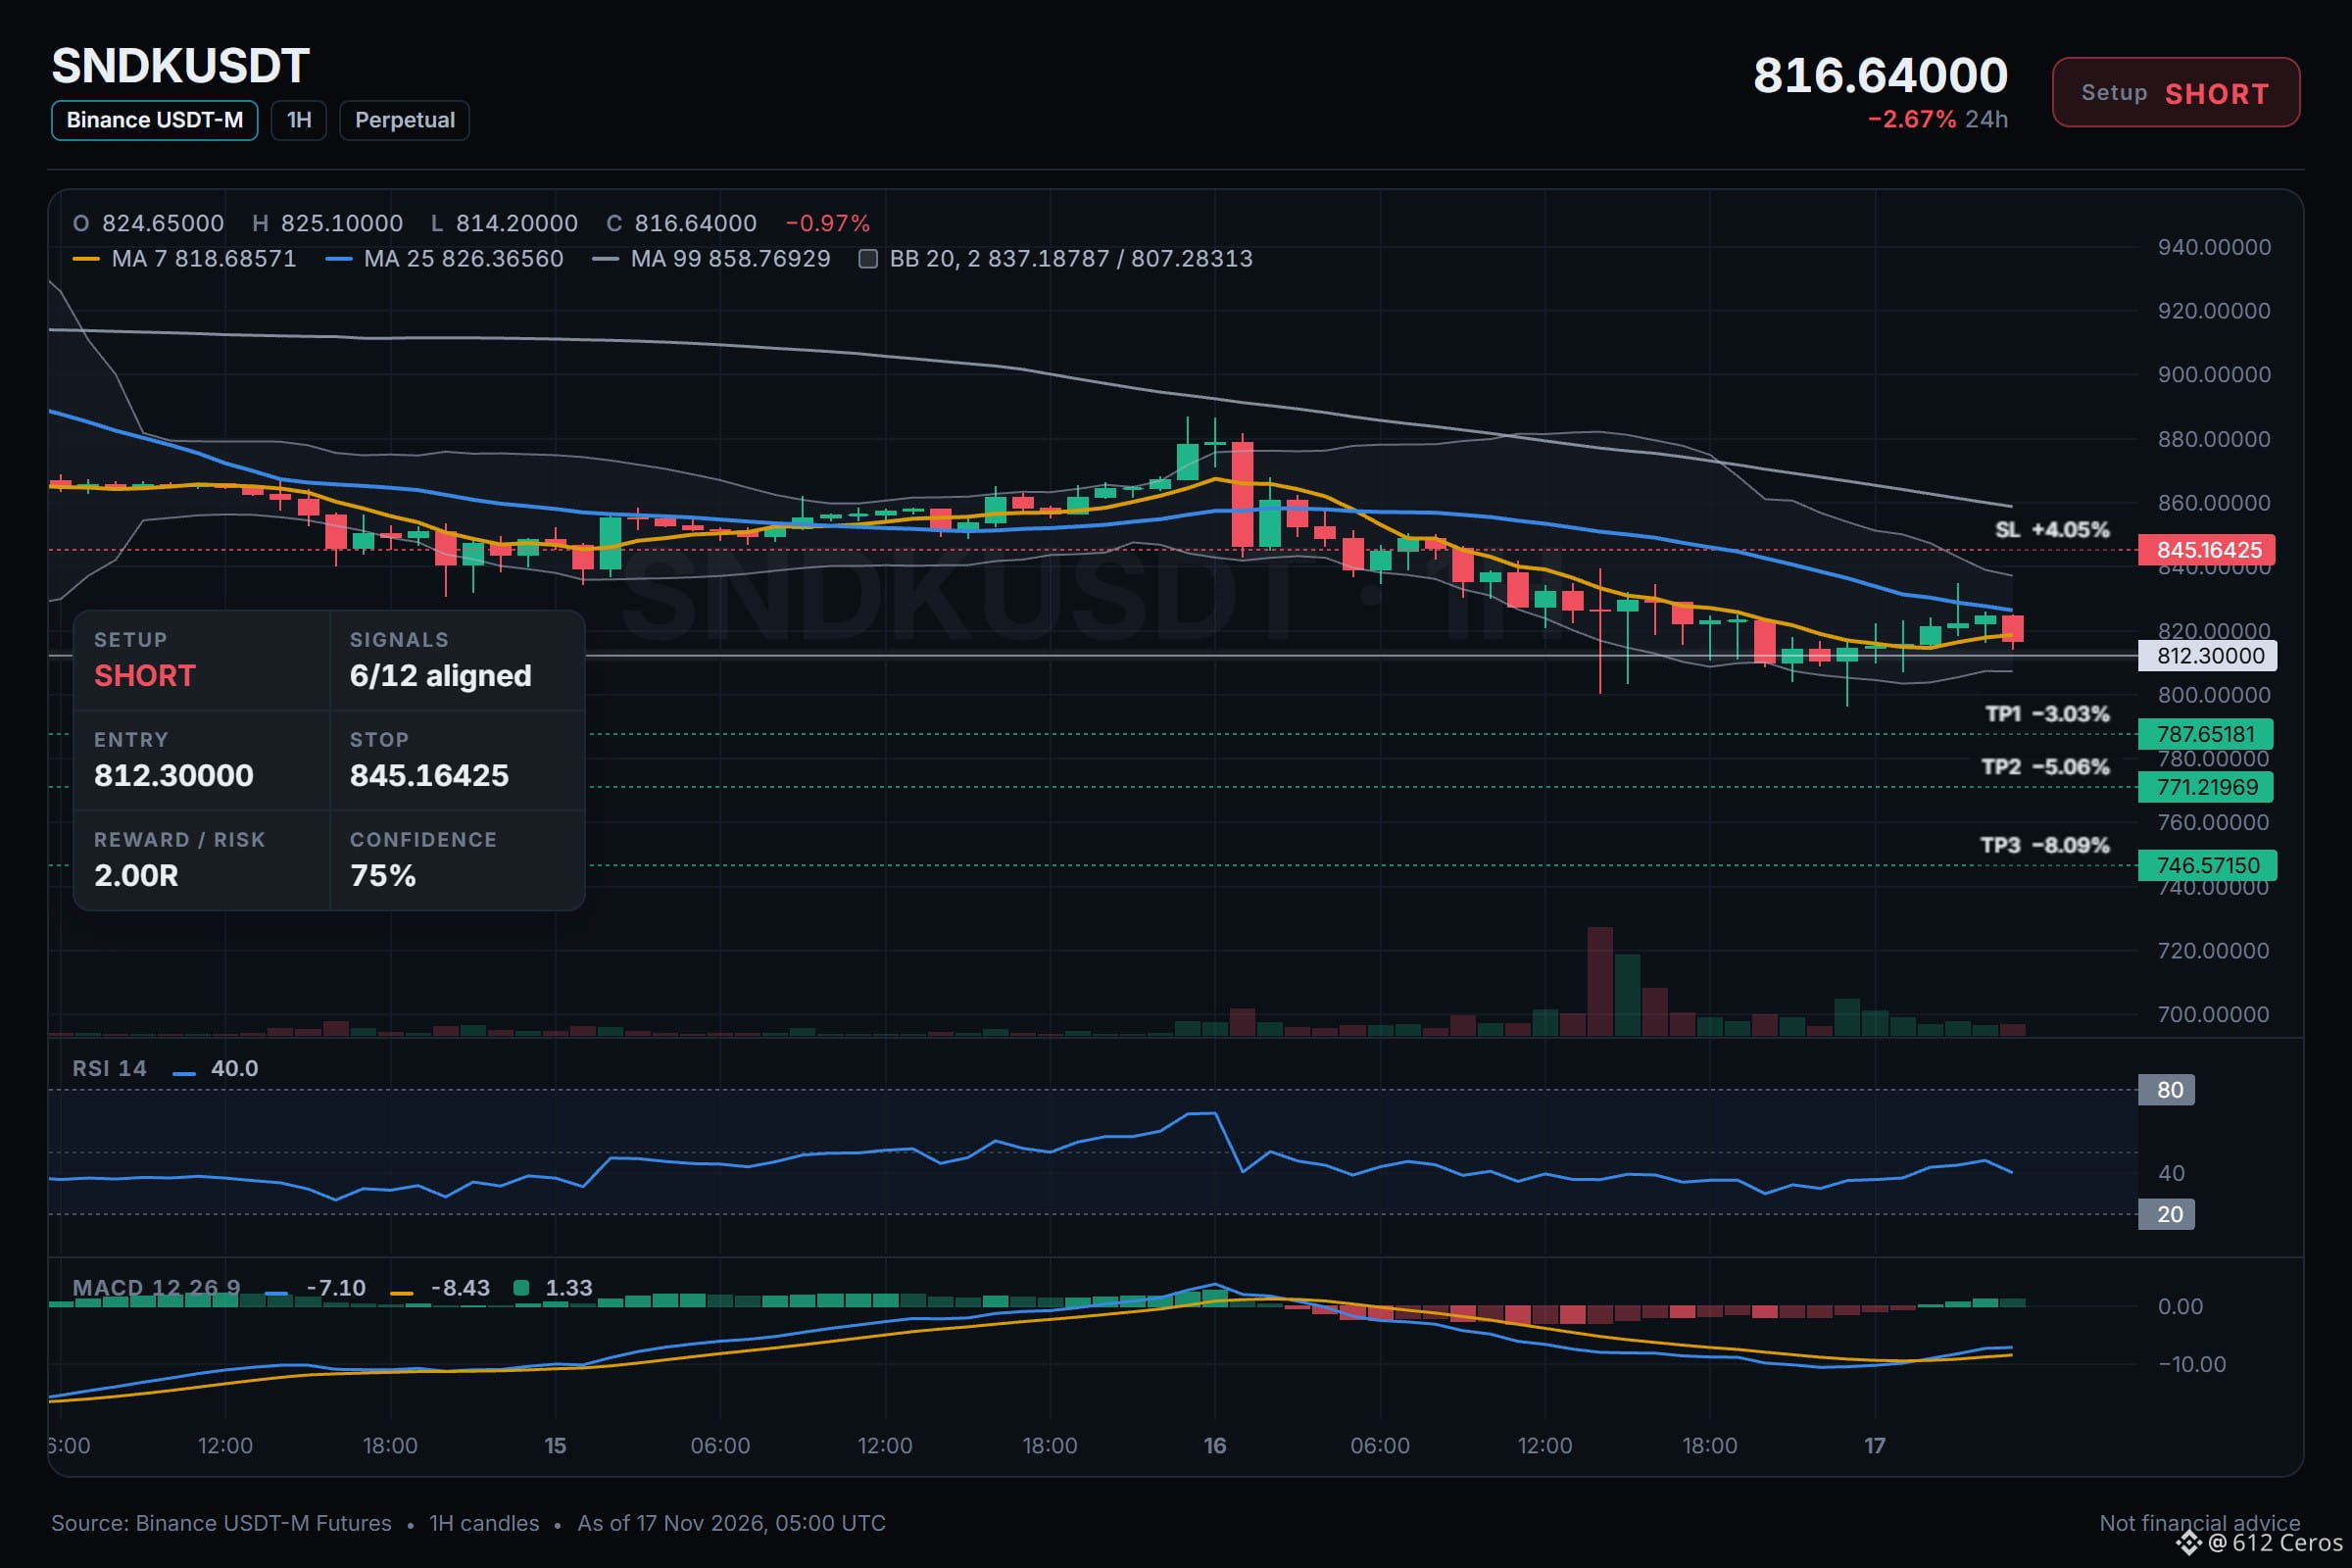
SNDK shows a bearish EMA stack on both 4h and 1h charts, pointing lower.
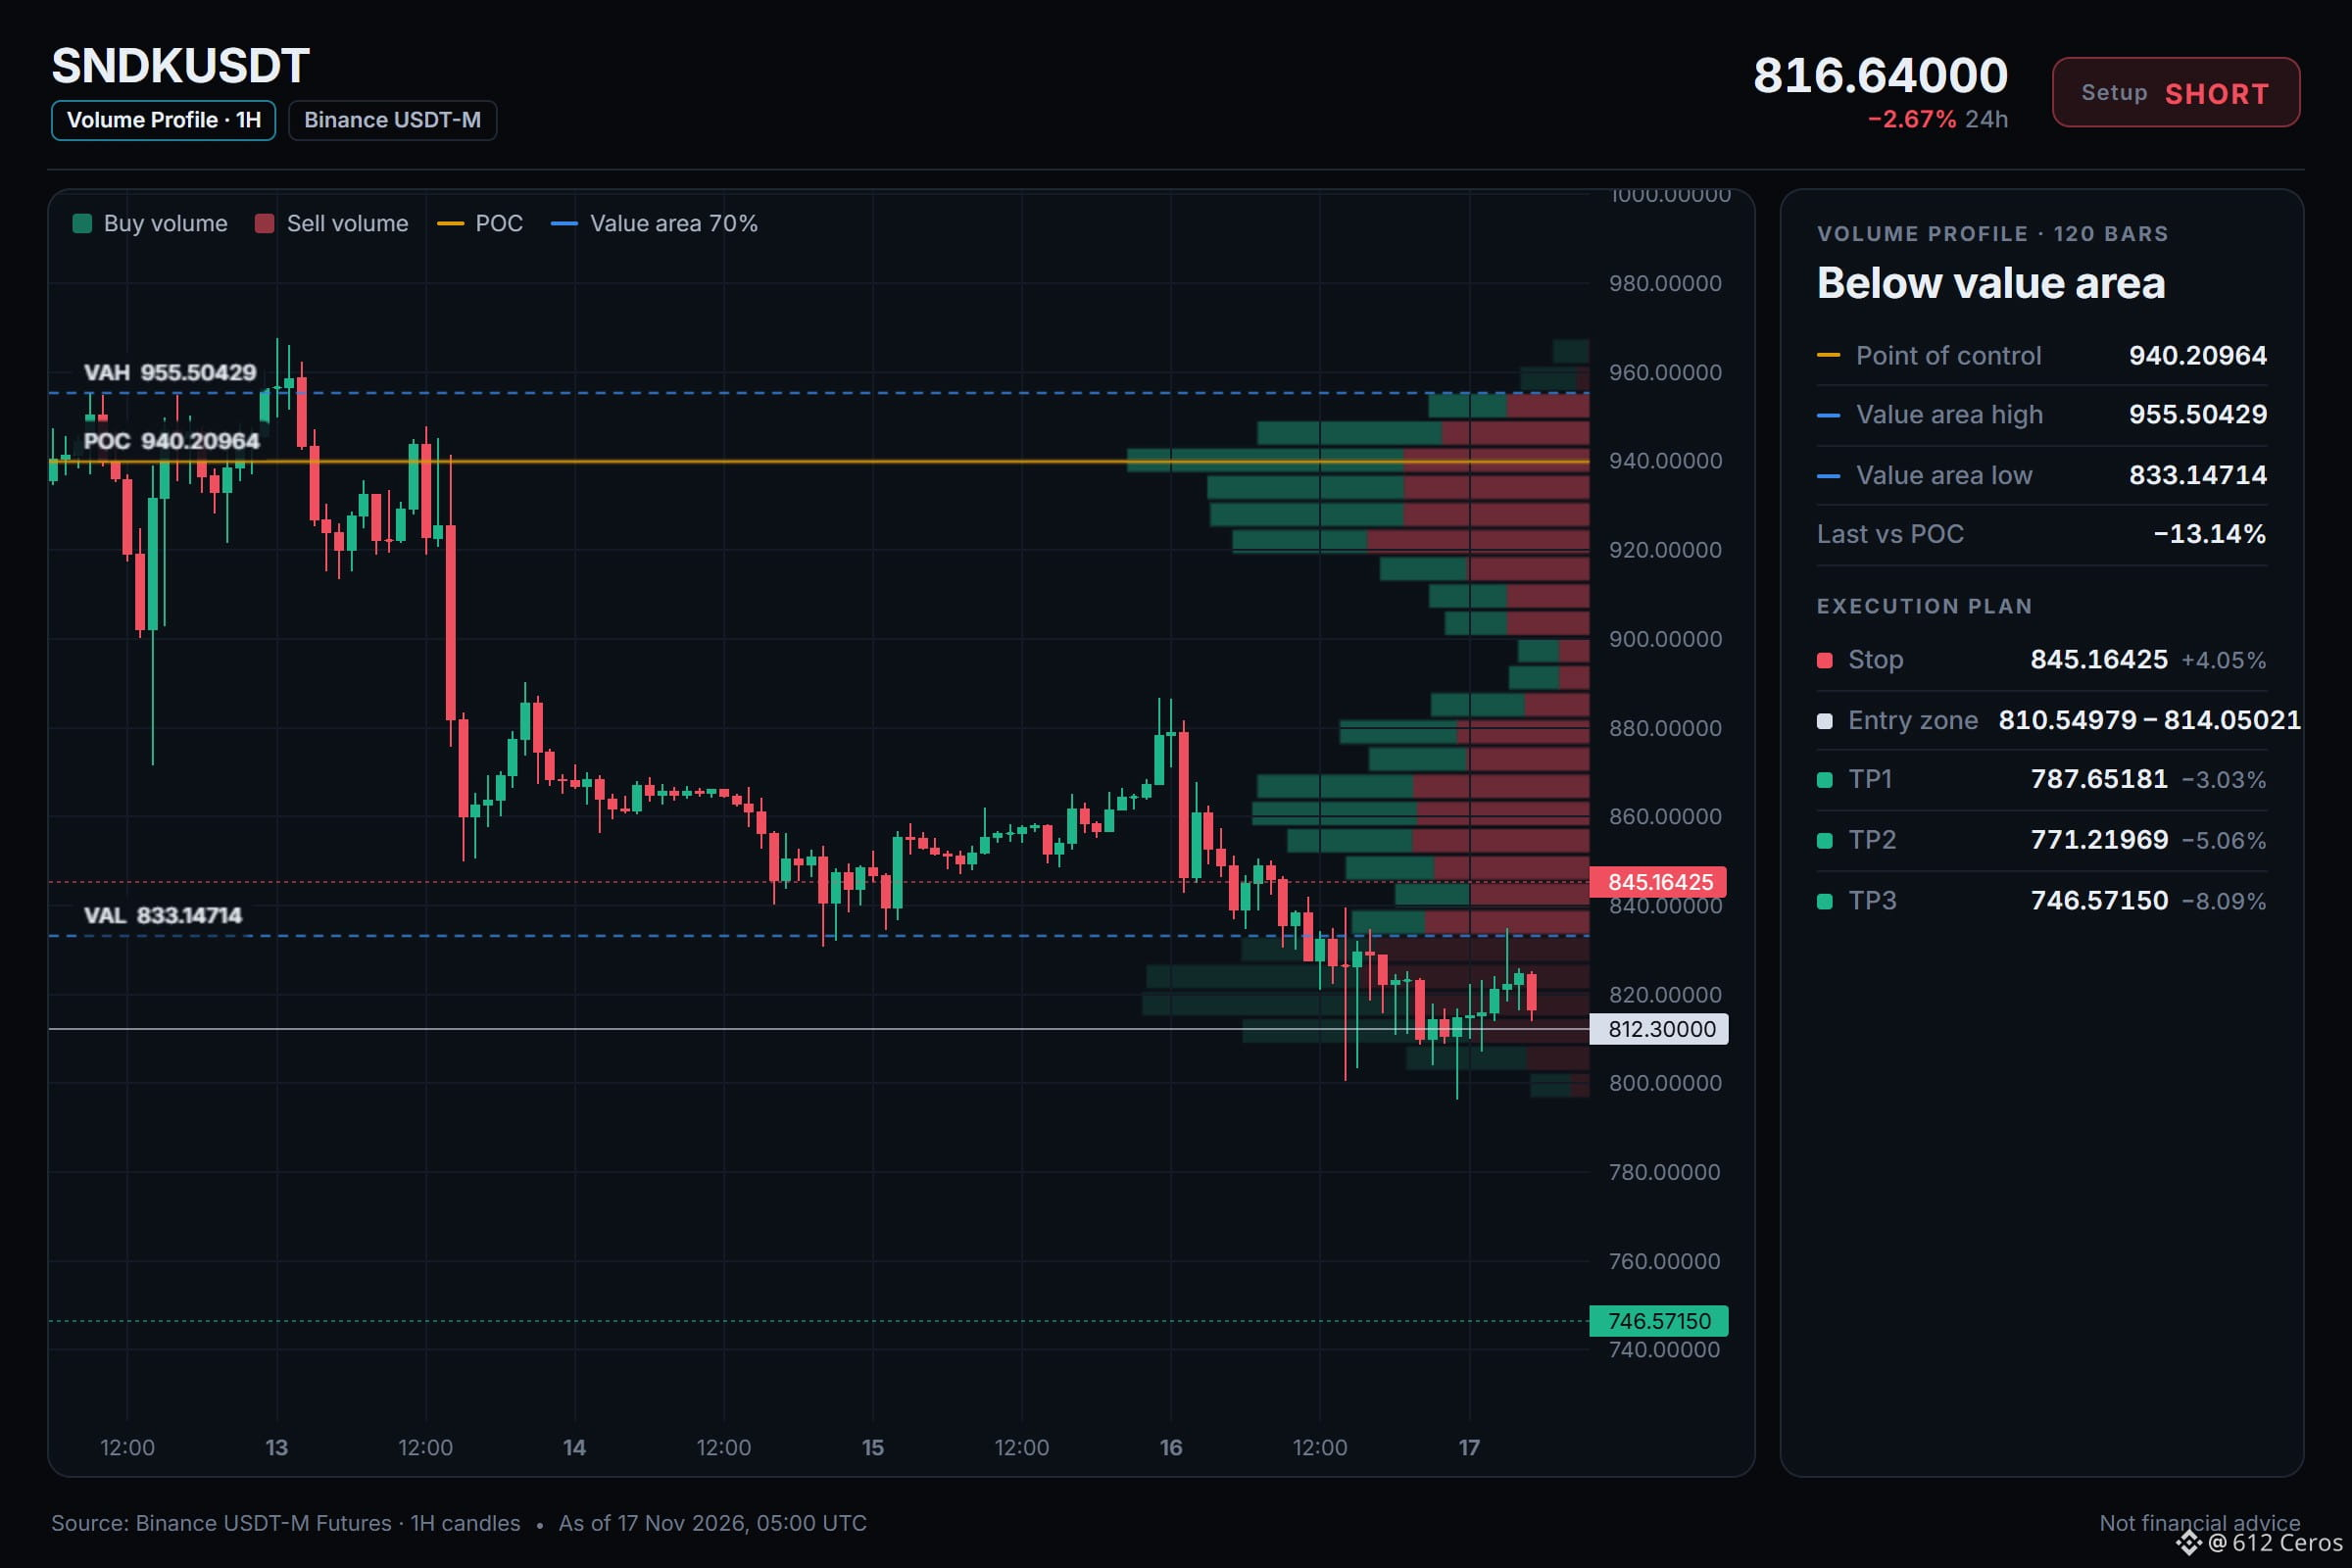
Entry: 810.54979 – 814.05021
TP1: 787.65181 (-3.0%)
TP2: 771.21969 (-5.1%)
TP3: 746.57150 (-8.1%)
SL: 845.16425 (+4.0%)
Why: The daily trend is bearish with price below the EMA50 and EMA200, meaning the big picture trend is down.
Plan: close 50% at TP1, 25% at TP2, 25% at TP3, and move the stop to entry after TP1.
Do you think this short setup is worth taking right now?
⚠️ Personal market analysis only. NFA — manage risk and DYOR.
Educational content, not investment advice or a recommendation to buy, sell, deposit, or withdraw any asset. No paid promotion or referral/affiliate links.
SNDK shows a bearish EMA stack on both 4h and 1h charts, pointing lower.
Entry: 810.54979 – 814.05021
TP1: 787.65181 (-3.0%)
TP2: 771.21969 (-5.1%)
TP3: 746.57150 (-8.1%)
SL: 845.16425 (+4.0%)
Why: The daily trend is bearish with price below the EMA50 and EMA200, meaning the big picture trend is down.
Plan: close 50% at TP1, 25% at TP2, 25% at TP3, and move the stop to entry after TP1.
Do you think this short setup is worth taking right now?
⚠️ Personal market analysis only. NFA — manage risk and DYOR.
Educational content, not investment advice or a recommendation to buy, sell, deposit, or withdraw any asset. No paid promotion or referral/affiliate links.