

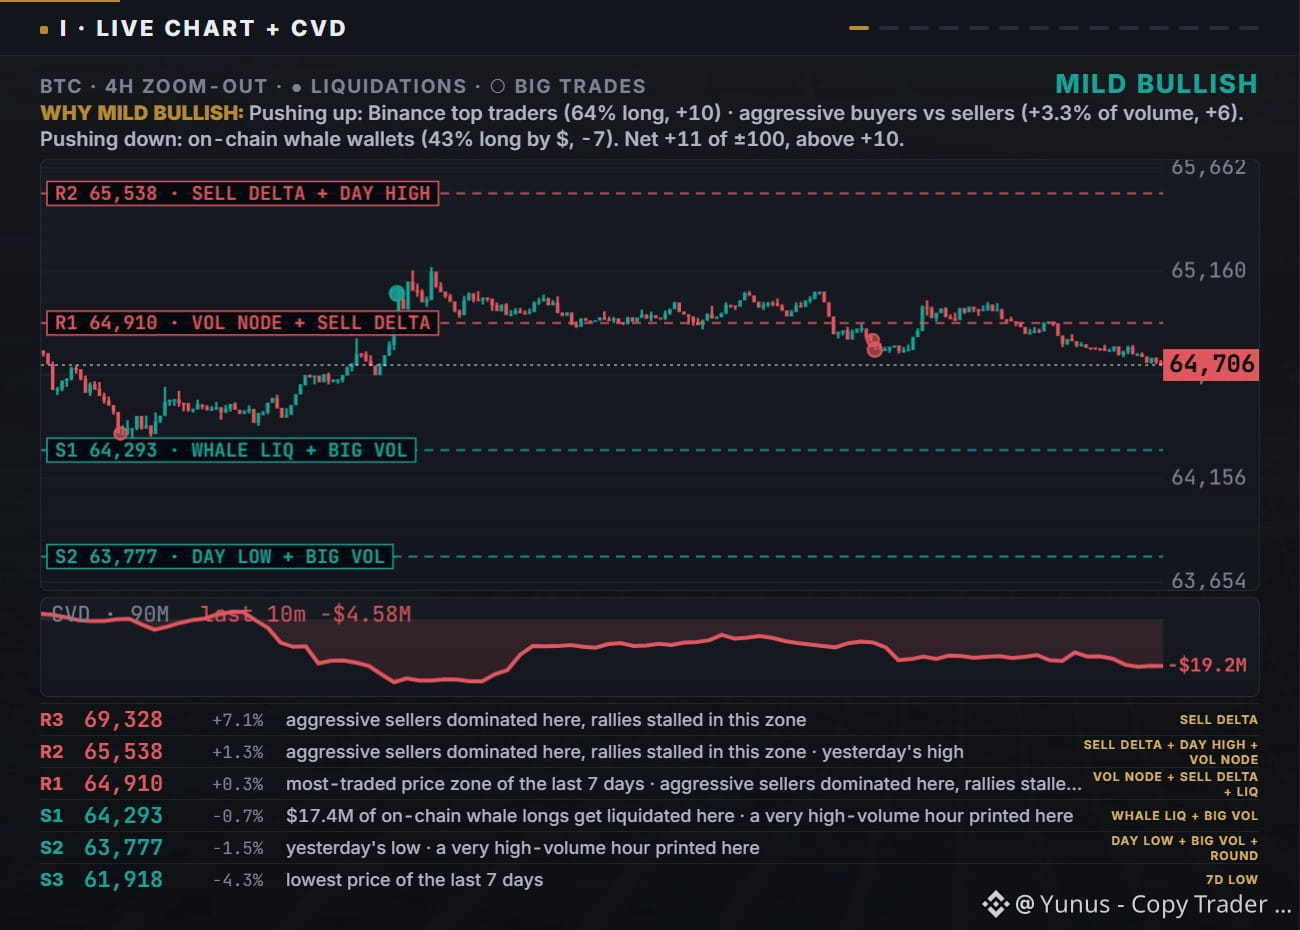
Since yesterday's $BTC map, 64,483 has turned from resistance into support, and the 65,294 to 65,538 band capped the rally at 65,679 before price stepped back. Now at 64,706 (06:13 UTC): R1 64,910 is the most-traded zone of the week, R2 65,538 is where sellers dominated, S1 64,293 has $17.4M of whale longs, S2 63,777 is yesterday's low. Which one gets tested first?
Krypto-Nutzer weltweit auf Binance Square kennenlernen
⚡️ Bleib in Sachen Krypto stets am Puls.
💬 Die weltgrößte Kryptobörse vertraut darauf.
👍 Erhalte verlässliche Einblicke von verifizierten Creators.
E-Mail-Adresse/Telefonnummer