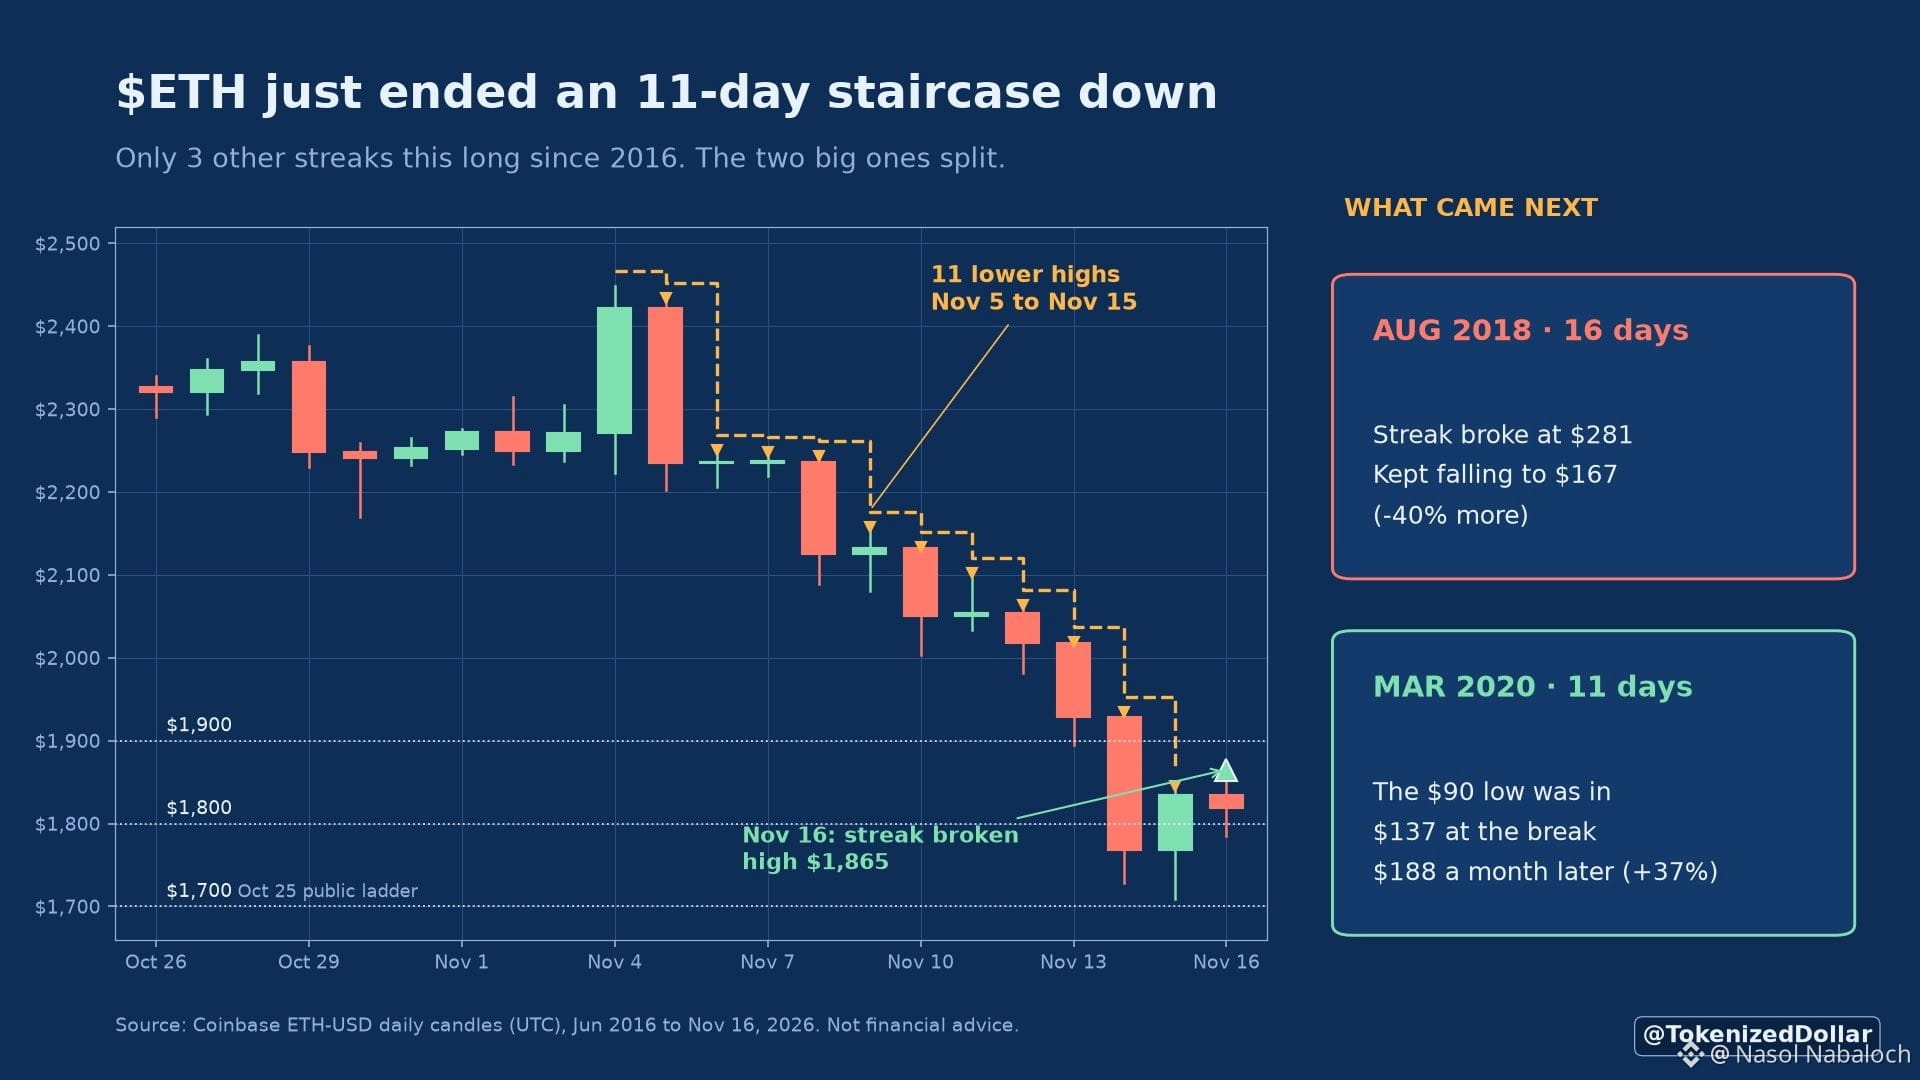
$ETH printed 11 straight lower daily highs, Nov 5 to Nov 15. Monday finally broke the streak.
That's happened only 3 other times on Coinbase since 2016. The two big ones went opposite ways:
• Aug 2018 (16 days): ETH fell another 40% after the break, $281 to $167
• Mar 2020 (11 days): the $90 low was already in. +37% a month later
So the streak ending isn't the signal. What comes next is: a higher low, then daily closes that hold.
The public line I'm watching: the $1,800 rung from my Oct 25 ladder. Closes above it keep the 2020 path open. A close back under it looks more like 2018.
Which one is this?
That's happened only 3 other times on Coinbase since 2016. The two big ones went opposite ways:
• Aug 2018 (16 days): ETH fell another 40% after the break, $281 to $167
• Mar 2020 (11 days): the $90 low was already in. +37% a month later
So the streak ending isn't the signal. What comes next is: a higher low, then daily closes that hold.
The public line I'm watching: the $1,800 rung from my Oct 25 ladder. Closes above it keep the 2020 path open. A close back under it looks more like 2018.
Which one is this?