EVAA/USDT Technical Analysis
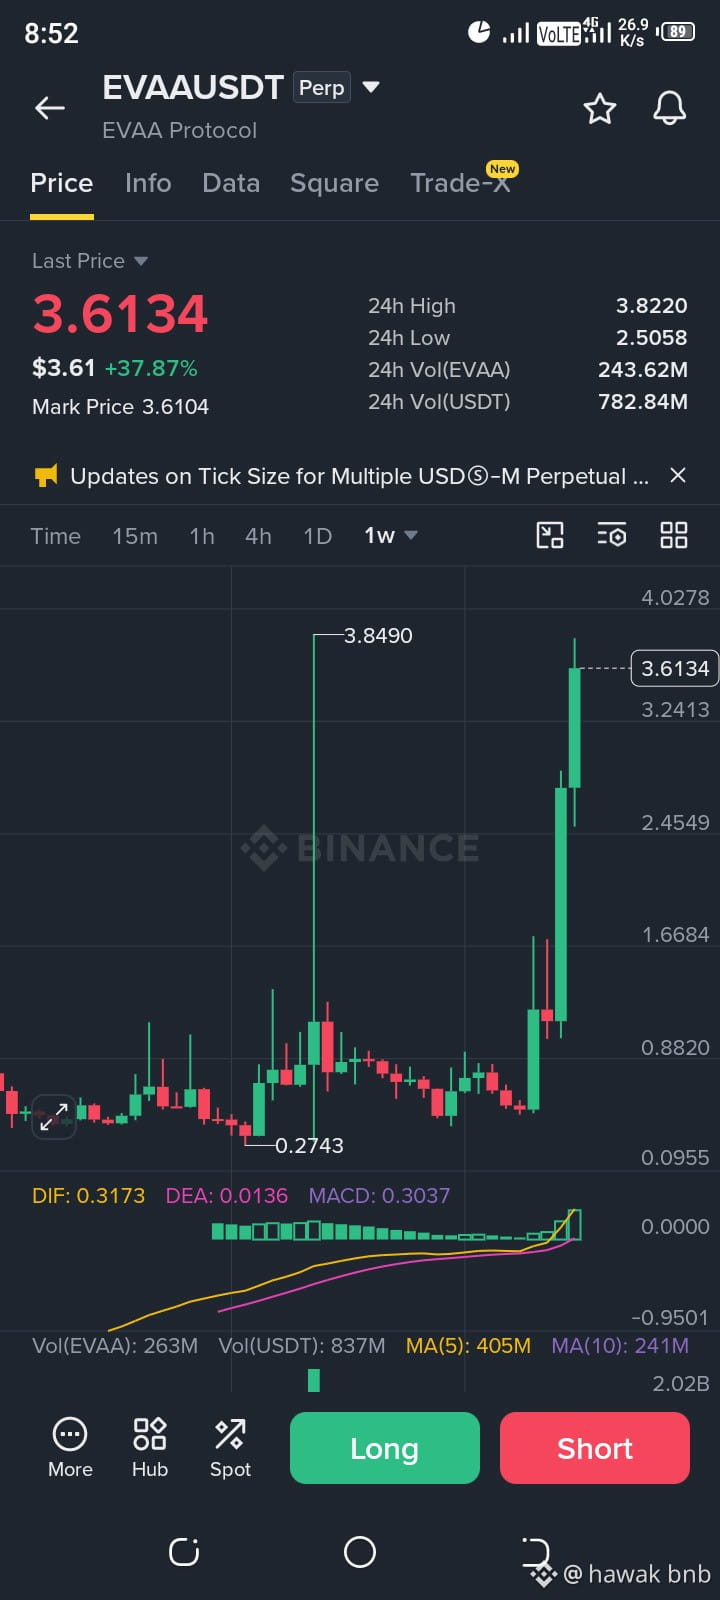
The 1-week (1W) chart for EVAA/USDT Perpetual on Binance reflects a high-momentum breakout and an explosive bullish trend. Currently trading at $3.6134, the asset has posted an impressive daily gain of +37.87%, continuing a broader macro expansion from its significant historical lows.
Price Action & Volatility
The weekly timeframe showcases immense price expansion following a prolonged consolidation phase above the $0.2743 major swing low. The token recently reached a 24-hour high of $3.8220 (with historical wicks touching up to $3.8490) before facing mild resistance near the $4.00 psychological barrier. The 24-hour low is marked at $2.5058, demonstrating strong underlying bid support that quickly absorbed selling pressure during intraday pullbacks.
Volume & Liquidity
Market participation is exceptionally robust, backed by a 24-hour trading volume of 243.62M EVAA and 782.84M USDT. This massive surge in capital influx validates the bullish continuation pattern, indicating that institutional and retail interest is heavily skewed toward momentum accumulation.
Momentum & Indicators
MACD: The Moving Average Convergence Divergence indicator reveals powerful bullish momentum. The DIF line (0.3173) is situated significantly above the DEA line (0.0136), accompanied by expanding green histogram bars (MACD: 0.3037), signaling strong trend continuation without immediate signs of macro exhaustion.
Moving Averages & Support/Resistance: Immediate support is established around the $3.2413 and $2.4549 structural levels. A sustained hold above these zones will likely pave the way for a retest of the $3.8490 resistance, with a clean breakout targeting price discovery above $4.0278.
@Evaa_ #EVAAUSDT🔻 $EVAA #WhatInvestmentSignalsDo13FFilingsReveal? #StablecoinMarketShrinksAtFastestPaceSinceTerraLuna
#AnthropicIPOTestsInvestorAppetiteForAI #NvidiaBoardNotConsideringHuang’sReturnasCEO
The 1-week (1W) chart for EVAA/USDT Perpetual on Binance reflects a high-momentum breakout and an explosive bullish trend. Currently trading at $3.6134, the asset has posted an impressive daily gain of +37.87%, continuing a broader macro expansion from its significant historical lows.
Price Action & Volatility
The weekly timeframe showcases immense price expansion following a prolonged consolidation phase above the $0.2743 major swing low. The token recently reached a 24-hour high of $3.8220 (with historical wicks touching up to $3.8490) before facing mild resistance near the $4.00 psychological barrier. The 24-hour low is marked at $2.5058, demonstrating strong underlying bid support that quickly absorbed selling pressure during intraday pullbacks.
Volume & Liquidity
Market participation is exceptionally robust, backed by a 24-hour trading volume of 243.62M EVAA and 782.84M USDT. This massive surge in capital influx validates the bullish continuation pattern, indicating that institutional and retail interest is heavily skewed toward momentum accumulation.
Momentum & Indicators
MACD: The Moving Average Convergence Divergence indicator reveals powerful bullish momentum. The DIF line (0.3173) is situated significantly above the DEA line (0.0136), accompanied by expanding green histogram bars (MACD: 0.3037), signaling strong trend continuation without immediate signs of macro exhaustion.
Moving Averages & Support/Resistance: Immediate support is established around the $3.2413 and $2.4549 structural levels. A sustained hold above these zones will likely pave the way for a retest of the $3.8490 resistance, with a clean breakout targeting price discovery above $4.0278.
@Evaa_ #EVAAUSDT🔻 $EVAA #WhatInvestmentSignalsDo13FFilingsReveal? #StablecoinMarketShrinksAtFastestPaceSinceTerraLuna
#AnthropicIPOTestsInvestorAppetiteForAI #NvidiaBoardNotConsideringHuang’sReturnasCEO