**BTC LTF Analysis** (based on the chart)
**Current structure:**
$BTC
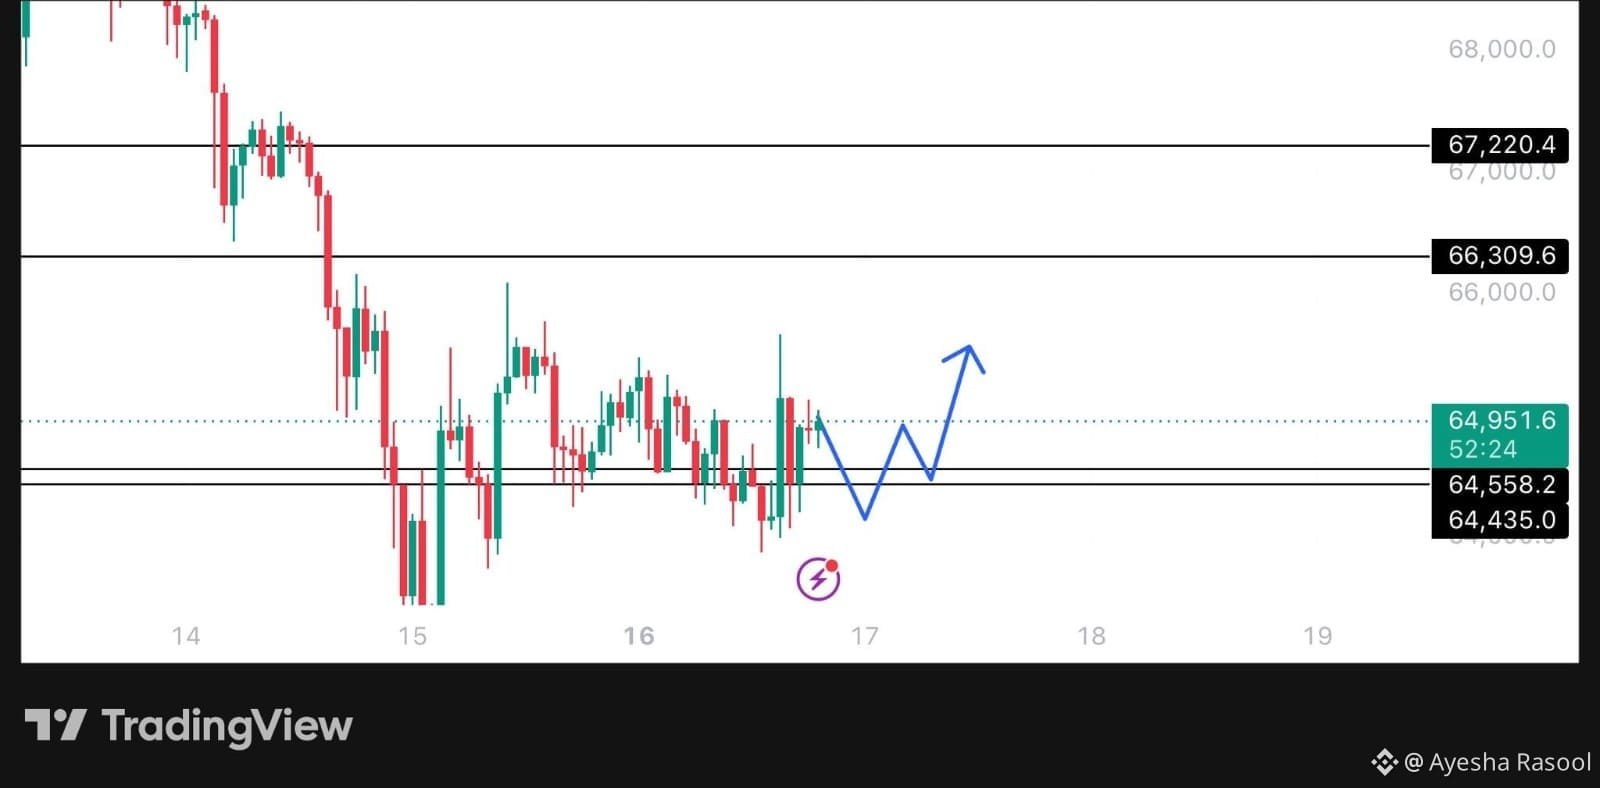
is coming out of a sharp sell-off from the 68k+ area. After the drop, price has been chopping in a range roughly between **64,400 – 65,200**. The blue drawing on the chart shows a clear bullish expectation — higher low followed by a push higher.
**Key levels visible on the chart:**
- **Resistance:**
66,309
67,220
- **Support / Demand zone:**
64,951 (current area)
64,558
64,435 (stronger support)
**What the chart is saying right now:**
- Price is sitting right on the mid-range support.
- The blue zigzag + upward arrow is projecting a recovery move if this support holds.
- The purple lightning mark appears to be highlighting a potential reaction / entry zone.
**Bias (LTF):**
Mildly bullish as long as **64,400–64,550** holds.
A clean hold + bounce from here opens the path toward 66,300 first, then 67,200.
**Invalidation:**
A decisive break and close below **64,400** would cancel the blue projection and open room for another leg lower.
**Simple plan many LTF traders are watching:**
- Long bias above 64,550–64,600
- Targets: 66,300 → 67,200
- Stop: below 64,400
Clean risk-reward setup if the support continues to hold.
#AnthropicIPOTestsInvestorAppetiteForAI
#BTC突破7万大关 #BTC☀ #Cryptotown_live #CryptoNewss
**Current structure:**
$BTC
is coming out of a sharp sell-off from the 68k+ area. After the drop, price has been chopping in a range roughly between **64,400 – 65,200**. The blue drawing on the chart shows a clear bullish expectation — higher low followed by a push higher.
**Key levels visible on the chart:**
- **Resistance:**
66,309
67,220
- **Support / Demand zone:**
64,951 (current area)
64,558
64,435 (stronger support)
**What the chart is saying right now:**
- Price is sitting right on the mid-range support.
- The blue zigzag + upward arrow is projecting a recovery move if this support holds.
- The purple lightning mark appears to be highlighting a potential reaction / entry zone.
**Bias (LTF):**
Mildly bullish as long as **64,400–64,550** holds.
A clean hold + bounce from here opens the path toward 66,300 first, then 67,200.
**Invalidation:**
A decisive break and close below **64,400** would cancel the blue projection and open room for another leg lower.
**Simple plan many LTF traders are watching:**
- Long bias above 64,550–64,600
- Targets: 66,300 → 67,200
- Stop: below 64,400
Clean risk-reward setup if the support continues to hold.
#AnthropicIPOTestsInvestorAppetiteForAI
#BTC突破7万大关 #BTC☀ #Cryptotown_live #CryptoNewss