🚨$PIEVERSE USDT: Bulls Are Preparing for Another Run Toward $2.27
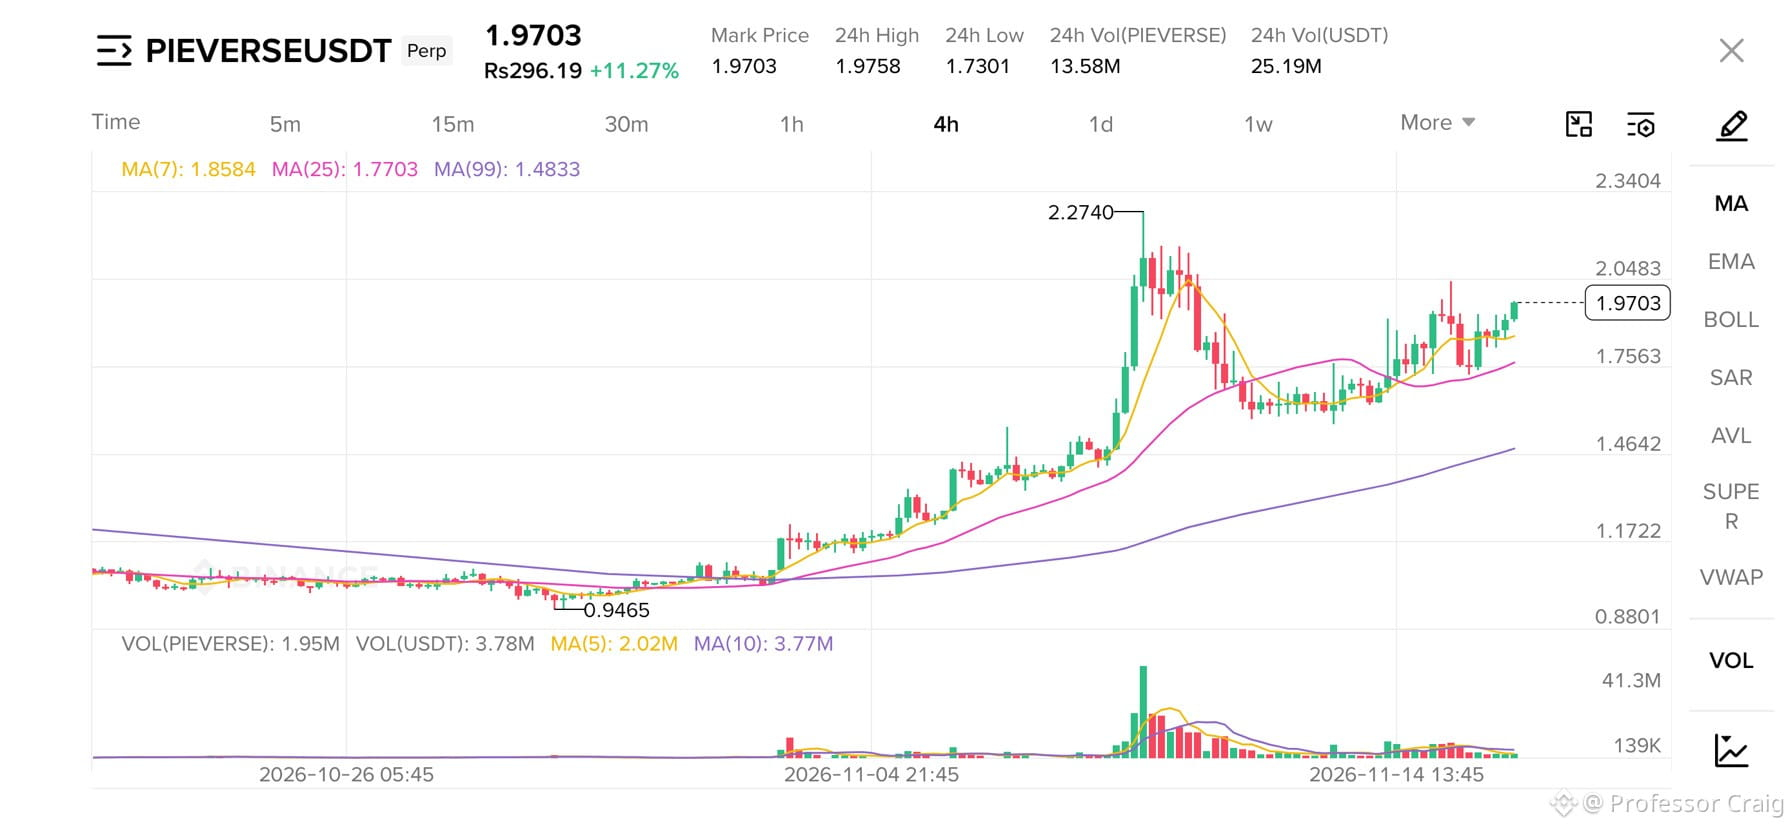
It is showing a strong bullish structure on the 4 hour chart, and the latest price action suggests that buyers are gradually regaining control after the previous correction. Trading around $1.9703, it has recovered significantly from its earlier consolidation near $0.95 and is now approaching an important resistance area.
The first thing worth noticing is the moving average structure. The MA(7) is at $1.8584, the MA(25) is at $1.7703, and the MA(99) is at $1.4833. Price is trading above all three moving averages, which is a positive indication that the broader trend remains bullish. More importantly, the shorter moving averages are positioned above the longer ones, supporting the current recovery.
The next major level to watch is $2.0483. A strong 4-hour candle close above this resistance, supported by increasing trading volume, could open the door for another move toward the previous high of $2.2740. That is the level bulls should have on their radar.
On the downside, $1.8584 is the first important support, followed by $1.7703. Holding above these areas would help maintain the current bullish structure. Losing them could weaken the recovery and bring another consolidation phase.
What makes this setup interesting is that the market has already experienced a major breakout, followed by a correction and a period of consolidation. The current recovery is bringing price back toward the upper resistance zone. Volume will be particularly important here because a breakout without meaningful buying activity may struggle to sustain itself. My bias remains bullish while price holds above the moving average support structure. A clean breakout above $2.0483 would be the next major signal, with $2.2740 as the previous high and potential retest target.
It is showing a strong bullish structure on the 4 hour chart, and the latest price action suggests that buyers are gradually regaining control after the previous correction. Trading around $1.9703, it has recovered significantly from its earlier consolidation near $0.95 and is now approaching an important resistance area.
The first thing worth noticing is the moving average structure. The MA(7) is at $1.8584, the MA(25) is at $1.7703, and the MA(99) is at $1.4833. Price is trading above all three moving averages, which is a positive indication that the broader trend remains bullish. More importantly, the shorter moving averages are positioned above the longer ones, supporting the current recovery.
The next major level to watch is $2.0483. A strong 4-hour candle close above this resistance, supported by increasing trading volume, could open the door for another move toward the previous high of $2.2740. That is the level bulls should have on their radar.
On the downside, $1.8584 is the first important support, followed by $1.7703. Holding above these areas would help maintain the current bullish structure. Losing them could weaken the recovery and bring another consolidation phase.
What makes this setup interesting is that the market has already experienced a major breakout, followed by a correction and a period of consolidation. The current recovery is bringing price back toward the upper resistance zone. Volume will be particularly important here because a breakout without meaningful buying activity may struggle to sustain itself. My bias remains bullish while price holds above the moving average support structure. A clean breakout above $2.0483 would be the next major signal, with $2.2740 as the previous high and potential retest target.