
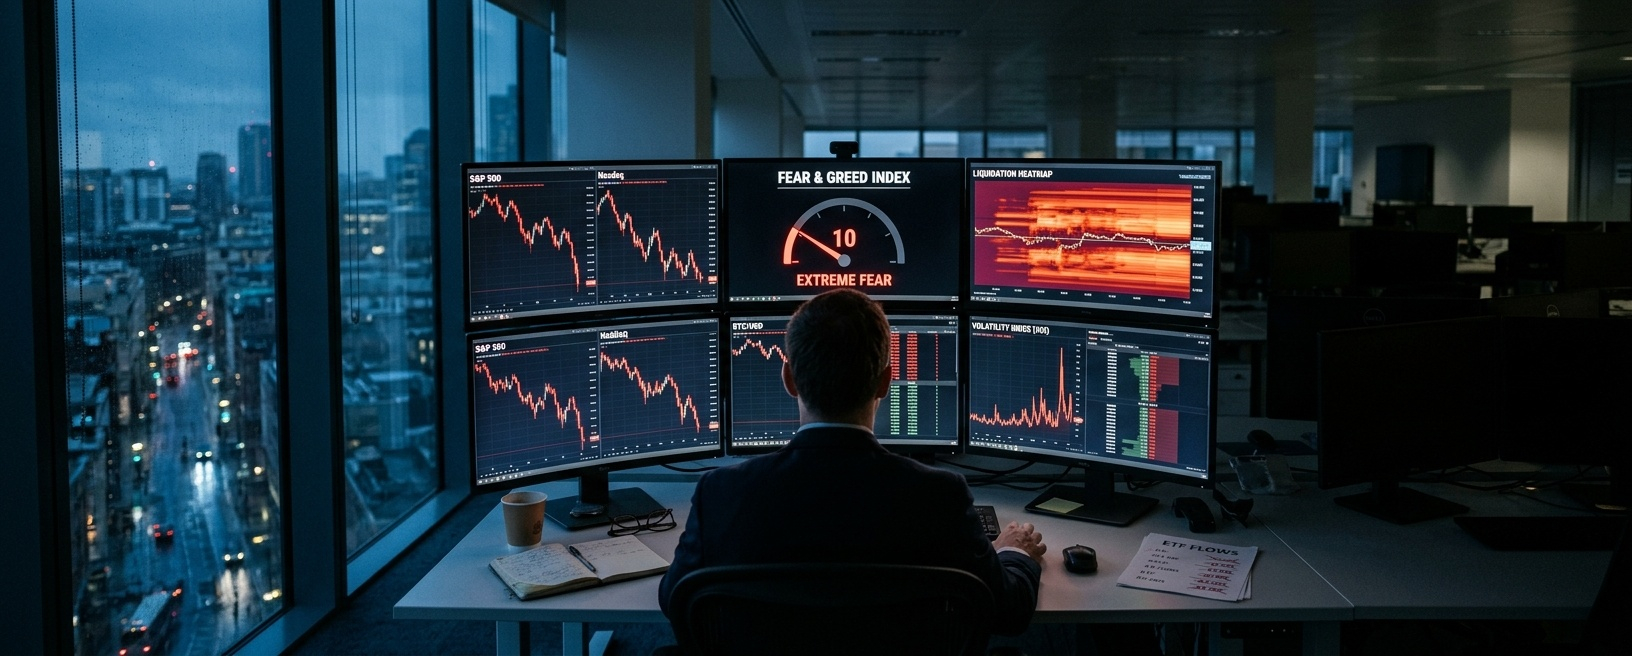


The crypto Fear & Greed Index just printed 10. If you've been in this market for more than one cycle, you know that number doesn't show up often. It's the kind of reading that makes you sit up straight—not because it's a buy signal, but because it tells you something about the psychology of the moment.
Bitcoin is hovering near $63,984 after a brutal 14.4% weekly decline. US spot Bitcoin ETFs have bled $1.91 billion across seven consecutive sessions through November 13. BlackRock's IBIT alone shed $143.5 million on Friday . Weekend liquidations topped $1.96 billion before cooling to $243 million . And yet, something doesn't add up. The open interest didn't spike the way it typically does during a capitulation. Funding rates flipped negative for the first time since March . This looks less like a leverage flush and more like a liquidity vacuum—a market where sellers pushed price into a void, and buyers simply stepped aside.
Let me explain why this distinction matters right now.
The Setup: Fear at Extremes, But No Panic Button
The Fear & Greed Index at 10 is the lowest reading since June . Historically, sub-10 prints have clustered around genuine macro stress points: the COVID crash in March 2020, the post-FTX washout in late 2022 . Those were moments when the system itself felt fragile. Today feels different. The fragility is real, but it's concentrated in flows, not in solvency.
The ETF outflow streak is the longest since launch. Seven straight sessions of net redemptions, with IBIT accounting for roughly 90% of the November withdrawals . Fidelity's FBTC contributed $41.9 million on Friday . What stands out to me is the concentration. When one vehicle—the largest and most liquid—absorbs nearly all the selling pressure, it tells you institutions are adjusting exposure quickly through the cleanest instrument available. It doesn't necessarily mean they're abandoning Bitcoin. It means they're de-risking in size, and IBIT is the path of least resistance.
Whale behavior adds another layer. Onchain Lens flagged a single whale receiving 4,000 BTC (~$259M) and transferring 347 BTC to Binance, Bitget, and other venues within 24 hours . That's not accumulation. That's preparation for distribution. When large holders move coins to exchanges during a sentiment trough, they're not testing the waters. They're positioning to sell into any bounce.
Technical & On-Chain: The $62K–$63K Demand Tail
Here's where the chart gets interesting. The weekend sweep below $64,000 created a **liquidity void**—a price range where resting orders were thin, and a relatively modest sell order could push price disproportionately lower. Bitcoin tagged the $62,000–$63,000 zone and bounced. That zone now functions as a demand tail. If it holds, the sweep was a stop run, not a regime change.
Funding rates flipping negative is the tell. For the first time since March, perps are pricing shorts to pay longs . That's spot-led selling, not leveraged shorting. In a classic capitulation, you'd see open interest spike as longs get forcibly closed, funding rates spike negative, and then a violent snapback. We didn't get that. Open interest declined 1.84% while turnover fell 43%. Leverage has been washed out, but no aggressive repositioning has begun. The market is lighter, but it's also directionless.
Liquidation heatmaps show clustered pain above $67,000–$70,000. If a reversal materializes, shorts stacked in that range become fuel. But here's the nuance: that fuel only ignites if ETF flows resume. Derivatives alone won't drive the next leg.
Institutional Flow: The Real Variable
Let me be direct about something. The $1.91 billion outflow isn't just a sentiment signal. It's a dollar-liquidity signal. Every redeemed ETF share removes dollar-denominated exposure from the system. A fourth consecutive week of withdrawals would tighten conditions further, and that matters because crypto is competing for the same marginal capital as AI listings, tech equities, and short-duration treasuries.
Metric Reading Signal
Fear & Greed 10 (Extreme Fear) Retail capitulation
ETF Outflows (7 sessions) $1.91B Institutional de-risking
Funding Rate Negative Spot-led selling
Open Interest Change -1.84% Leverage washed out
Whale Exchange Inflows 347 BTC / 24h Distribution prep
The counter-argument is straightforward: ETF flows are backward-looking. By the time the data prints, the move has already happened. A single strong session of inflows—even $200–300 million—would flip the narrative faster than any technical level. The products aren't broken. The appetite is simply dormant.
Risks, Opportunities, and What Actually Matters
The bear case: If ETF redemptions continue for a fourth week, the $62K zone probably breaks. Below that, the next meaningful demand area sits lower, and the liquidity void extends. Whale distribution into any bounce caps upside. Macro headwinds—rate expectations, dollar strength—keep risk appetite suppressed.
The bull case: Extreme fear at 10 has historically marked medium-term value zones, not precise bottoms . Negative funding with washed-out open interest means the market is clean. A resumption of ETF inflows, even modest, triggers short covering into the $67K–$70K cluster. The liquidity sweep was the bottom.
My read: The data suggests this is a liquidity vacuum, not a trend shift. The absence of a capitulation-style open interest spike is the key divergence. Forced selling has paused. Capital is sidelined. The next directional move will be driven by ETF flow resumption, not derivatives positioning.
Watch the first two trading days of the coming week. If IBIT prints a positive flow day—even a small one—the short-side fuel above $67K becomes live. If redemptions continue, $62K is the line in the sand.
That's the setup. Not hype. Not doom. Just a market holding its breath.

