Don't Miss $BTC Update 🚀
The biggest long cluster sitting at 60-62K. Price went there, cleared it out, and came right back. The market always goes where most people's money is. Yesterday that money was below, so price dropped. Today the money is building above.
Above 68K there are roughly $950M in short liquidations, almost $1 billion, while below 63K there is only about $378M. That means roughly 3x more fuel sits above than below. This is why 68K is our key reversal level. If price holds above it, the bounce can continue. If not, the lower levels stay in play.
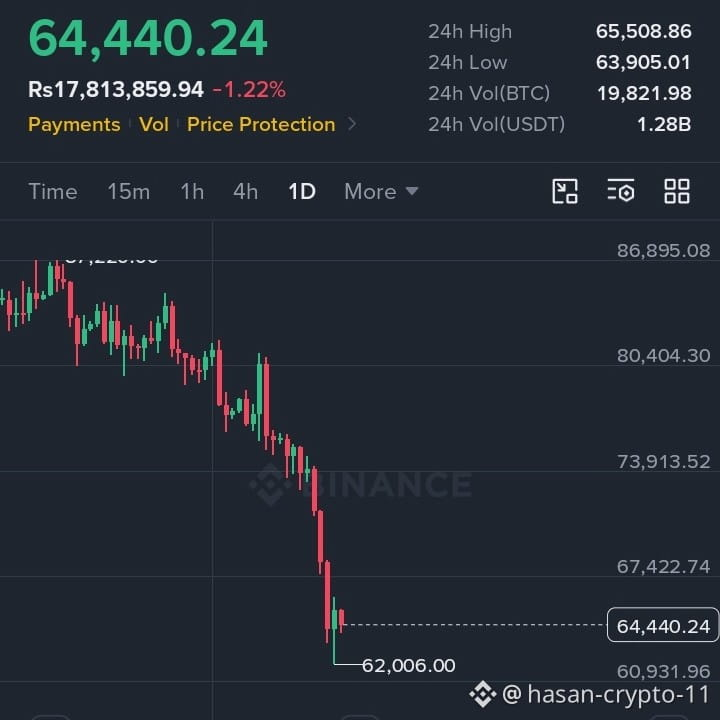
On the daily chart, today's candle is a hammer with a long lower wick. It shows buyers stepping in with real momentum for the first time since this downtrend began. Price also made a lower low while RSI made a higher low, which is a bullish divergence that wasn't there yesterday. But this is a signal, not a confirmation. Confirmation comes only when we get a daily close above 68K.
History adds some context. Yesterday's daily RSI hit 19.7, a level reached only 8 times since 2018. In 4 of those 8 cases the bottom came within 2 days: March 2020, January 2022, June 2022 and February 2026. In February, the wick to 60K closed the same day at 70K. In 6 of the 8 cases a big bounce followed. However, in November 2018, with RSI near 20, BTC still fell another 43%.
Oversold conditions guarantee a bounce, not a bottom. The bounce is what the market is offering us right now, so wait for the daily close above 68K before treating it as confirmed. 📊
Not financial advice.
$BTC
#TradingCommunity
#BTC
#btcupdates
#Market_Update
The biggest long cluster sitting at 60-62K. Price went there, cleared it out, and came right back. The market always goes where most people's money is. Yesterday that money was below, so price dropped. Today the money is building above.
Above 68K there are roughly $950M in short liquidations, almost $1 billion, while below 63K there is only about $378M. That means roughly 3x more fuel sits above than below. This is why 68K is our key reversal level. If price holds above it, the bounce can continue. If not, the lower levels stay in play.
On the daily chart, today's candle is a hammer with a long lower wick. It shows buyers stepping in with real momentum for the first time since this downtrend began. Price also made a lower low while RSI made a higher low, which is a bullish divergence that wasn't there yesterday. But this is a signal, not a confirmation. Confirmation comes only when we get a daily close above 68K.
History adds some context. Yesterday's daily RSI hit 19.7, a level reached only 8 times since 2018. In 4 of those 8 cases the bottom came within 2 days: March 2020, January 2022, June 2022 and February 2026. In February, the wick to 60K closed the same day at 70K. In 6 of the 8 cases a big bounce followed. However, in November 2018, with RSI near 20, BTC still fell another 43%.
Oversold conditions guarantee a bounce, not a bottom. The bounce is what the market is offering us right now, so wait for the daily close above 68K before treating it as confirmed. 📊
Not financial advice.
$BTC
#TradingCommunity
#BTC
#btcupdates
#Market_Update