$ETH is trading around $1,820 and still in a downtrend, but heavily oversold. It sat near $1,816 on Monday, close to a rising trendline from 2020. Sunday closed at $1,834 after a dip to $1,710, the lowest price in the last 90 daily sessions. (coincentral) (thecryptobasic)
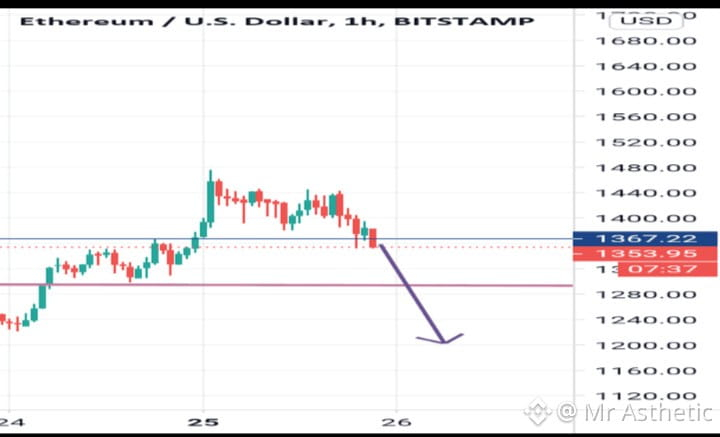
Here are chart pictures to follow along (they're live TradingView-style charts, so check the latest candles yourself):
What the chart says
Trend: ETH is below its 20-, 50- and 200-day moving averages. It also lost the old $1,900–$1,980 demand zone. (tradersunion) (cryptorank)
Momentum: Daily RSI is about 25 (oversold), but MACD is still negative. Sunday's bounce didn't produce a bullish MACD crossover. (blockchain) (thecryptobasic)
Pivot: Price is hovering just above the $1,812 pivot, an inflection area rather than a clean break. (blockchain)
Key levels
Support: $1,700–$1,800. (coincentral)
Resistance: $2,000 first, then $2,200–$2,400. (coincentral)
A bounce that fails under about $1,902 would leave the downtrend intact. (blockchain)
Flows
US spot Ether ETFs had $398.9M in net outflows over five sessions. BlackRock's ETHA led the selling, so passive demand hasn't stabilized yet. (coincentral) (blockchain)
Outlook: The near-term bias is bearish to neutral. A relief bounce toward $1,900–$2,000 is plausible given the oversold readings. A daily close below $1,700 would open further downside, while reclaiming $2,000 would be the first sign of a trend change.
This is a summary of public analysis, not financial advice.#CryptoSelloffTriggersMultipleWhaleLiquidations #HuangReportedlyConsidersReturnToNvidia
Here are chart pictures to follow along (they're live TradingView-style charts, so check the latest candles yourself):
What the chart says
Trend: ETH is below its 20-, 50- and 200-day moving averages. It also lost the old $1,900–$1,980 demand zone. (tradersunion) (cryptorank)
Momentum: Daily RSI is about 25 (oversold), but MACD is still negative. Sunday's bounce didn't produce a bullish MACD crossover. (blockchain) (thecryptobasic)
Pivot: Price is hovering just above the $1,812 pivot, an inflection area rather than a clean break. (blockchain)
Key levels
Support: $1,700–$1,800. (coincentral)
Resistance: $2,000 first, then $2,200–$2,400. (coincentral)
A bounce that fails under about $1,902 would leave the downtrend intact. (blockchain)
Flows
US spot Ether ETFs had $398.9M in net outflows over five sessions. BlackRock's ETHA led the selling, so passive demand hasn't stabilized yet. (coincentral) (blockchain)
Outlook: The near-term bias is bearish to neutral. A relief bounce toward $1,900–$2,000 is plausible given the oversold readings. A daily close below $1,700 would open further downside, while reclaiming $2,000 would be the first sign of a trend change.
This is a summary of public analysis, not financial advice.#CryptoSelloffTriggersMultipleWhaleLiquidations #HuangReportedlyConsidersReturnToNvidia