$SKL: How Leverage Might Hide in Volume Signals
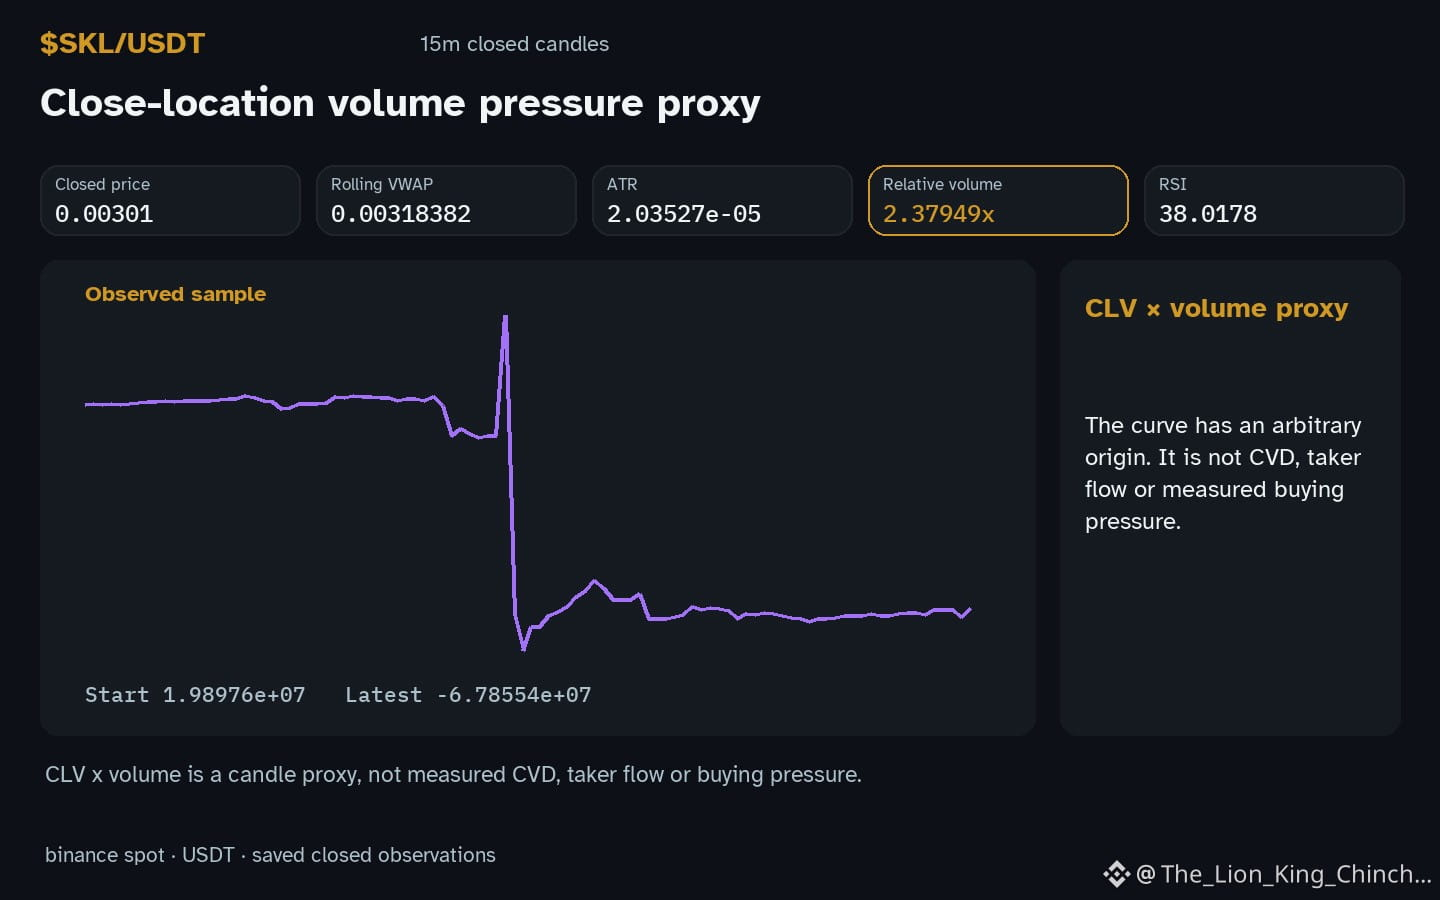
$SKL: SKL shows an hourly down direction while volume sits 2.38x baseline. Does the elevated volume necessarily imply leveraged pressure or could it be a benign market rhythm? One clue is the strong relative volume paired with a modest hourly change -0.331126%. This could suggest traders using futures to amplify a short bias, yet the same data might simply reflect heightened spot activity unrelated to leverage.
A possible alternative reading is that the volume spike stems from algorithmic rebalancing or a liquidity event that does not involve leveraged positions. If the RSI 38.0 remains in a neutral band, the price move may lack the overbought or oversold tension that typically fuels leveraged entries. Conversely, a low RSI could be taken as a signal that leveraged short sellers are stepping in, reinforcing the first hypothesis.
To weaken the leverage‑driven interpretation, observe a subsequent candle where the price stabilizes despite continued high volume, or where the RSI moves toward the midpoint without a pronounced divergence. Such closed‑candle evidence would indicate that the volume is not translating into directional pressure and that the market is absorbing trades without leverage amplification.
A concrete reassessment step is to track the next hourly candle: if the price change remains small and the RSI stays steady while volume stays above baseline, the leverage hypothesis loses weight. This simple check separates a hypothesis about leveraged moves from ordinary volume dynamics without assigning intent or causality.
Probabilistic market research, not a recommendation or guaranteed return.
For a wider view: $BTC has hourly direction up and volume above its baseline; $GLMR has hourly direction up and volume above its baseline. This alone does not establish correlation.
#SKL #BTC
$SKL: SKL shows an hourly down direction while volume sits 2.38x baseline. Does the elevated volume necessarily imply leveraged pressure or could it be a benign market rhythm? One clue is the strong relative volume paired with a modest hourly change -0.331126%. This could suggest traders using futures to amplify a short bias, yet the same data might simply reflect heightened spot activity unrelated to leverage.
A possible alternative reading is that the volume spike stems from algorithmic rebalancing or a liquidity event that does not involve leveraged positions. If the RSI 38.0 remains in a neutral band, the price move may lack the overbought or oversold tension that typically fuels leveraged entries. Conversely, a low RSI could be taken as a signal that leveraged short sellers are stepping in, reinforcing the first hypothesis.
To weaken the leverage‑driven interpretation, observe a subsequent candle where the price stabilizes despite continued high volume, or where the RSI moves toward the midpoint without a pronounced divergence. Such closed‑candle evidence would indicate that the volume is not translating into directional pressure and that the market is absorbing trades without leverage amplification.
A concrete reassessment step is to track the next hourly candle: if the price change remains small and the RSI stays steady while volume stays above baseline, the leverage hypothesis loses weight. This simple check separates a hypothesis about leveraged moves from ordinary volume dynamics without assigning intent or causality.
Probabilistic market research, not a recommendation or guaranteed return.
For a wider view: $BTC has hourly direction up and volume above its baseline; $GLMR has hourly direction up and volume above its baseline. This alone does not establish correlation.
#SKL #BTC