

BITCOIN: THE TRILLION-DOLLAR MONEY FLOW — WHY THE BIGGER PICTURE STILL MATTERS
Many people look at Bitcoin’s price and see just another cryptocurrency moving up and down. But when you look at its market capitalization over the years, you begin to understand the bigger picture: Bitcoin has grown into one of the world’s major financial assets.
Let’s look at how far it has come.
From millions to trillions
In its early years, Bitcoin’s market capitalization was relatively small. As adoption increased, more individuals, businesses and institutional investors began paying attention.
2013: Bitcoin’s market cap was still below $10 billion for much of the year.
2017: It crossed the $100 billion milestone and surged toward $300 billion.
2021: Bitcoin reached approximately $1.27 trillion in market capitalization.
2024: It crossed the $2 trillion milestone.
2025: Its market capitalization reached approximately $2.49 trillion at its peak.
That is a remarkable transformation in just over a decade.
It tells us something important: Bitcoin has continued attracting attention and capital across different market cycles, despite major corrections along the way.
Why every Bitcoin move can represent billions or trillions
Here is something many investors misunderstand.
Bitcoin’s market capitalization is calculated by multiplying its circulating supply by its current market price.
This means when Bitcoin’s price changes, the estimated market value of the entire circulating supply changes too.
For example, if Bitcoin’s market capitalization moves from $1.29 trillion to $1.39 trillion, that is a $100 billion increase in its total market value.
But this does not mean $100 billion in cash necessarily entered Bitcoin. Market capitalization reflects the latest market price applied to the circulating supply, not the total amount of money invested.
This is why even relatively small percentage moves in Bitcoin can represent enormous changes in market value.
What my chart is telling us
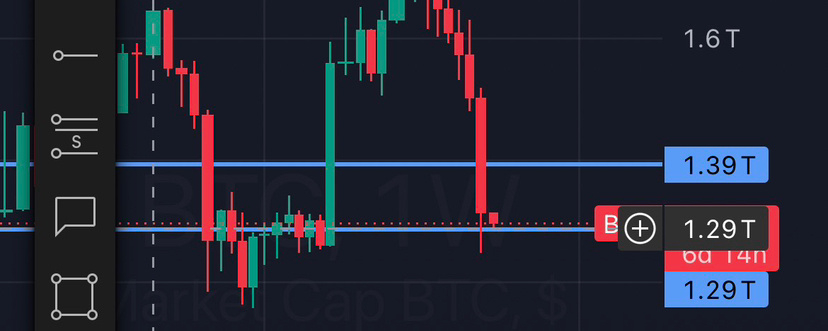
Looking at my $BTC market-cap chart, I am watching two important levels:
Support: $1.29 trillion
This is the level where buyers have previously shown interest. Bitcoin is currently testing this area, making it important to watch how the market reacts.
If buyers defend this support and market capitalization begins recovering, it could create room for another bullish move.
Resistance: $1.39 trillion
This is the next important level I am watching.
A convincing move above $1.39 trillion, followed by a successful retest, could strengthen the bullish outlook and open the door for further recovery.
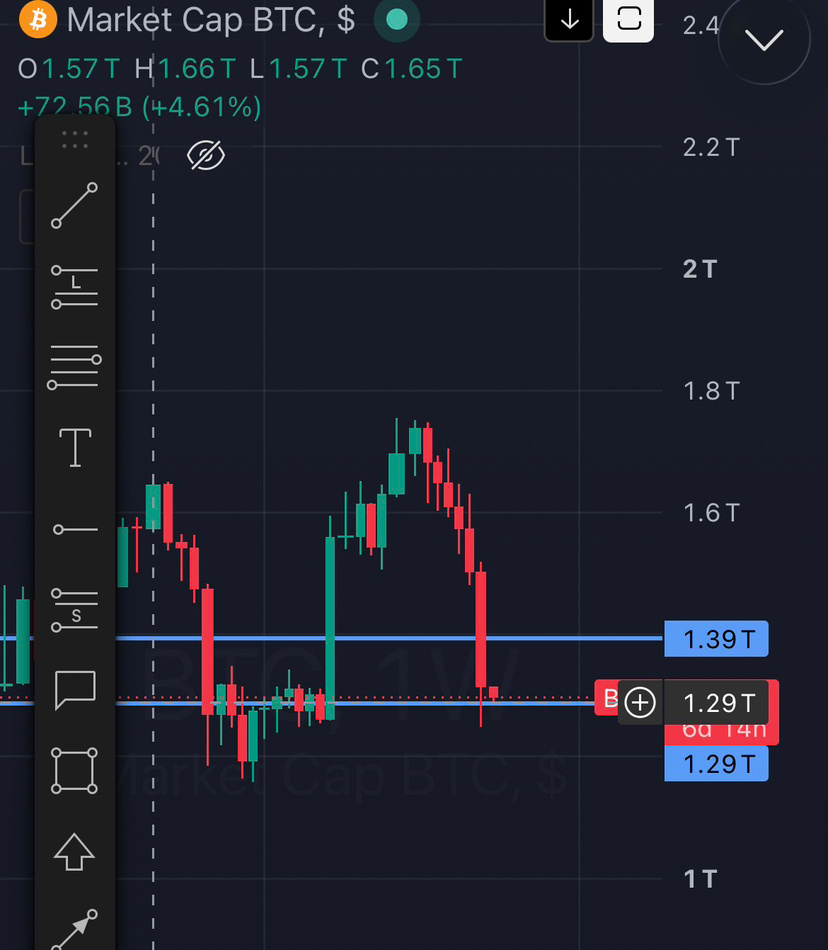
However, if the $1.29 trillion support fails, we could see additional downside pressure.
The previous move toward approximately $1.66 trillion also shows how quickly Bitcoin’s market value can expand when bullish momentum returns.
Bitcoin versus gold: Is there still room to grow?
Gold has been a major store of value for generations. Bitcoin, on the other hand, is a much younger asset with a different investment profile.
Bitcoin’s market capitalization remains considerably smaller than the estimated value of gold. That difference is one reason some investors believe Bitcoin still has room to grow as adoption expands.
But being smaller than gold does not automatically mean Bitcoin will catch up, and Bitcoin carries significantly higher volatility and risk.
My point is simple: investors should not judge Bitcoin only by its current price. They should also understand its market capitalization, adoption, supply dynamics and long-term potential.
The bigger opportunity may not be about chasing every short-term candle. It may be about understanding the asset, managing risk and recognising what is happening beneath the price chart.
Bitcoin has already demonstrated how far a relatively small market can grow. Its next chapter is still being written.
This is my personal market perspective, not financial advice. Always do your own research and manage your risk.