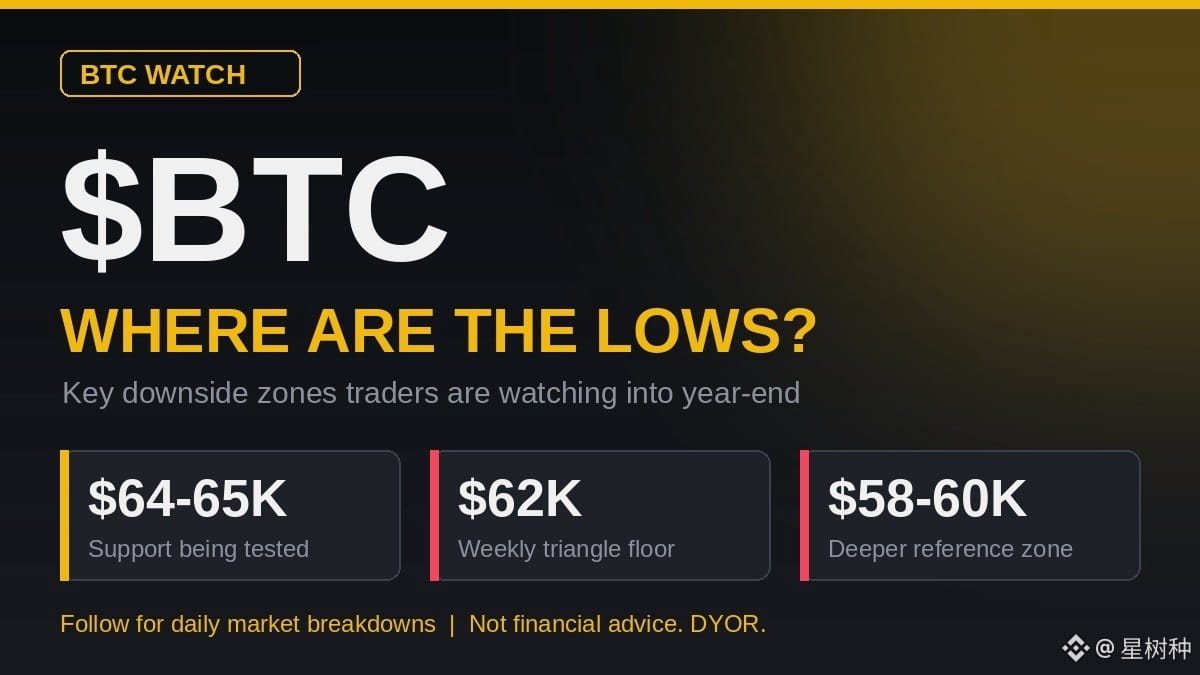
🚨 $BTC: Where Are The Lows? Key Downside Zones Into Year-End
Bitcoin is trading near $64.6K, about 26% below its late-September high (~$87.3K). Sentiment has flipped to Extreme Fear (19) and ETF flows are bleeding. Here’s what the chart is saying. 👇
📊 Market Snapshot
Metric Level
Price ~$64.6K
Late-Sept high ~$87.3K
Drawdown ~26%
Fear & Greed 19 (Extreme Fear)
US spot ETF flows ~$1.9B out over 7 sessions (to Nov 13)
⚡ What’s Driving The Pressure
1️⃣ Leverage flush: Over $1B in positions liquidated on Nov 9
2️⃣ Macro: Higher-for-longer rate outlook removes a support
3️⃣ ETF outflows: Institutional demand has cooled
4️⃣ Exchange stress: Net $3.64B withdrawn from Binance after the record $6.3B hack
🎯 Key Price Levels
🔻 $64K–$65K: Support under test. A decisive break turns the structure bearish
🔻 $62K: Weekly triangle floor. A close below puts $60K in play
🔻 $58K–$60K: Deeper reference zone (BTC traded near $58.5K on June 30)
🔺 $67K–$68K: 200-week average, first hurdle on any bounce
🔺 $70K: Former support, now resistance
🧠 Bottom Line
The most commonly cited downside scenario is a $60K–$62K flush. Reclaiming $70K would weaken that case. Nobody knows where the low is, so manage risk accordingly.
💬 Where do you think BTC bottoms? Drop your level below 👇
#BTC #Bitcoin #CryptoAnalysis #BinanceSquare #BTCPrice
⚠️ Not financial advice. Levels are technical references from third-party analysts, not predictions. Always DYOR.
Bitcoin is trading near $64.6K, about 26% below its late-September high (~$87.3K). Sentiment has flipped to Extreme Fear (19) and ETF flows are bleeding. Here’s what the chart is saying. 👇
📊 Market Snapshot
Metric Level
Price ~$64.6K
Late-Sept high ~$87.3K
Drawdown ~26%
Fear & Greed 19 (Extreme Fear)
US spot ETF flows ~$1.9B out over 7 sessions (to Nov 13)
⚡ What’s Driving The Pressure
1️⃣ Leverage flush: Over $1B in positions liquidated on Nov 9
2️⃣ Macro: Higher-for-longer rate outlook removes a support
3️⃣ ETF outflows: Institutional demand has cooled
4️⃣ Exchange stress: Net $3.64B withdrawn from Binance after the record $6.3B hack
🎯 Key Price Levels
🔻 $64K–$65K: Support under test. A decisive break turns the structure bearish
🔻 $62K: Weekly triangle floor. A close below puts $60K in play
🔻 $58K–$60K: Deeper reference zone (BTC traded near $58.5K on June 30)
🔺 $67K–$68K: 200-week average, first hurdle on any bounce
🔺 $70K: Former support, now resistance
🧠 Bottom Line
The most commonly cited downside scenario is a $60K–$62K flush. Reclaiming $70K would weaken that case. Nobody knows where the low is, so manage risk accordingly.
💬 Where do you think BTC bottoms? Drop your level below 👇
#BTC #Bitcoin #CryptoAnalysis #BinanceSquare #BTCPrice
⚠️ Not financial advice. Levels are technical references from third-party analysts, not predictions. Always DYOR.