🔥 $TRX Technical Update: Key Levels & Momentum Breakdown
📊 1. Market Snapshot
The $TRX token is currently changing hands at $0.3030, marking a minor 24-hour decline of -1.27 percent. Price action over the last session recorded a high of $0.3096 and a low near the immediate floor of $0.3029. 24-hour quote volume stands at $22,128,202 USDT with low participation ratios, suggesting a consolidation phase with subdued market conviction.
📈 2. Technical Momentum & Indicator Bias
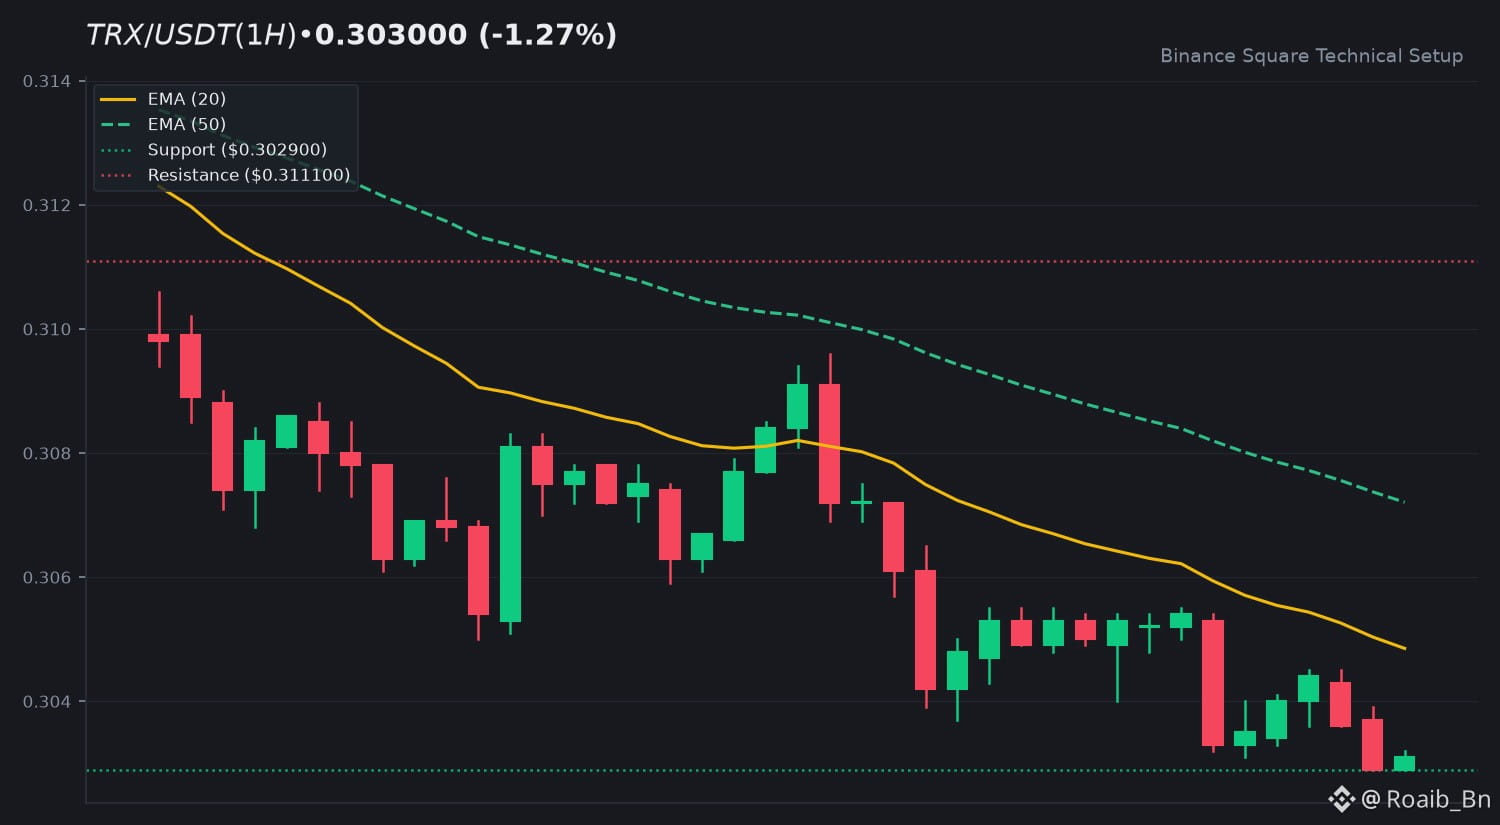
Technical Momentum & Market Bias currently shows a sustained downward posture. The EMA 20 rests at $0.3049 while the EMA 50 sits at $0.3072, confirming short-term price compression beneath key moving averages. The 14-period RSI prints at 35.77, reflecting weak buying pressure lingering near oversold territory without a definitive reversal signal yet. Meanwhile, the MACD histogram flatlines near -0.0000 alongside identical MACD and signal lines at -0.0012, highlighting quiet trend progression.
🎯 3. Key Technical Levels to Watch
• 🟢 Resistance Zone: $0.3111 acts as the primary overhead hurdle for bulls.
• 🔴 Support Zone: $0.3029 serves as the immediate support floor.
• 🛡️ Pivot Confluence: The EMA 20 zone at $0.3049 acts as the crucial pivot level.
💡 4. Technical Takeaway & Risk Management
Traders should closely monitor how price action interacts with the dynamic EMA resistance lines and the lower support boundary. Maintaining strict risk management protocols remains essential during low volume consolidation phases.
💬 5. Community Discussion
What is your technical outlook for $TRX this week? Are you monitoring the support floor or waiting for structural breakout confirmation? Drop your thoughts below! 👇
⚠️ 6. Disclaimer
Educational technical analysis only. Not financial advice (NFA). Crypto markets involve high risk. Always DYOR.
$TRX #TRX #BinanceSquare
📊 1. Market Snapshot
The $TRX token is currently changing hands at $0.3030, marking a minor 24-hour decline of -1.27 percent. Price action over the last session recorded a high of $0.3096 and a low near the immediate floor of $0.3029. 24-hour quote volume stands at $22,128,202 USDT with low participation ratios, suggesting a consolidation phase with subdued market conviction.
📈 2. Technical Momentum & Indicator Bias
Technical Momentum & Market Bias currently shows a sustained downward posture. The EMA 20 rests at $0.3049 while the EMA 50 sits at $0.3072, confirming short-term price compression beneath key moving averages. The 14-period RSI prints at 35.77, reflecting weak buying pressure lingering near oversold territory without a definitive reversal signal yet. Meanwhile, the MACD histogram flatlines near -0.0000 alongside identical MACD and signal lines at -0.0012, highlighting quiet trend progression.
🎯 3. Key Technical Levels to Watch
• 🟢 Resistance Zone: $0.3111 acts as the primary overhead hurdle for bulls.
• 🔴 Support Zone: $0.3029 serves as the immediate support floor.
• 🛡️ Pivot Confluence: The EMA 20 zone at $0.3049 acts as the crucial pivot level.
💡 4. Technical Takeaway & Risk Management
Traders should closely monitor how price action interacts with the dynamic EMA resistance lines and the lower support boundary. Maintaining strict risk management protocols remains essential during low volume consolidation phases.
💬 5. Community Discussion
What is your technical outlook for $TRX this week? Are you monitoring the support floor or waiting for structural breakout confirmation? Drop your thoughts below! 👇
⚠️ 6. Disclaimer
Educational technical analysis only. Not financial advice (NFA). Crypto markets involve high risk. Always DYOR.
$TRX #TRX #BinanceSquare