
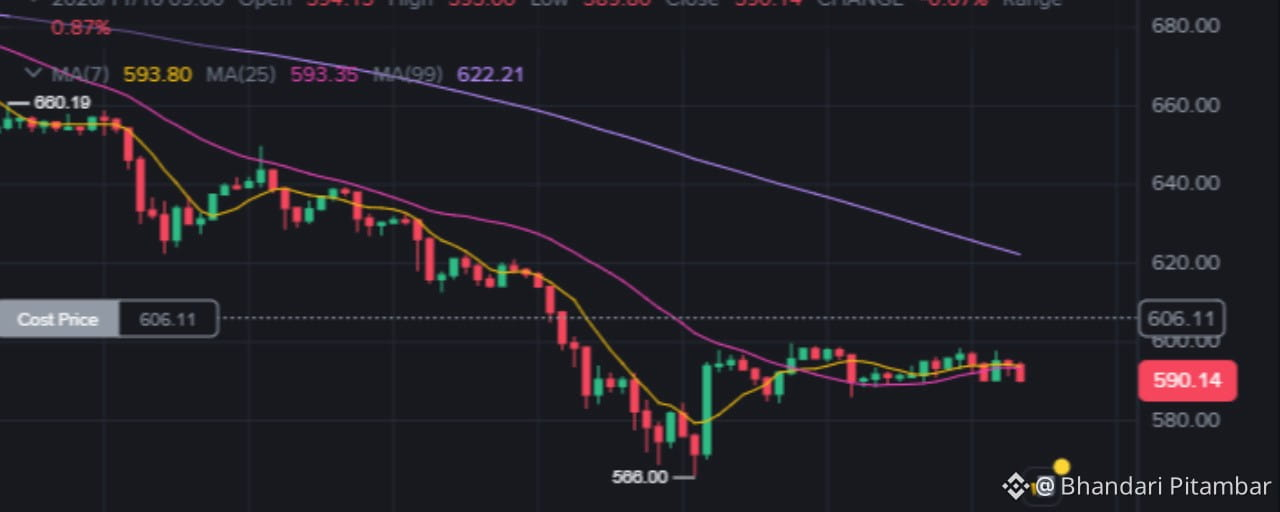

The crypto market is currently caught in a macroeconomic tug-of-war, and BNB is no exception. After a sharp decline from the $660 highs, BNB/USDT has found temporary footing around $590. But is this a genuine base-building phase, or just a pause before the next leg down? Let’s break down the charts, the data, and what it means for your portfolio.
The Macro Picture: Why Alts Are Bleeding
Before looking at BNB, we have to acknowledge the broader environment. Bitcoin dominance remains stubbornly high, sucking liquidity away from major altcoins. With the DXY (Dollar Index) maintaining strength and global equity markets showing mixed signals, risk assets are struggling to find a unified bullish narrative. Capital is currently hiding in USDT, not deploying into BNB.
BNB/USDT Technical Breakdown
Looking at the 1-hour chart, the reality is stark. BNB is trading at $590.14, sitting well below its medium-term trend indicator, the 99-period Moving Average (MA99), which rests at $622.21.
While the price has bounced from the $566 low, this recovery is happening on declining volume. In technical analysis, a bounce without volume is a warning sign, not a green light. The short-term moving averages (MA7 and MA25) are tangling around $593, indicating pure market indecision.
For bulls, the immediate hurdle is the $606 level. This is a massive psychological and structural barrier. Until BNB can close a 4-hour candle above $606 with conviction, the path of least resistance remains sideways to down.
Bullish vs. Bearish Scenarios
The Bullish Case (Low Probability Short-Term):
If BNB can absorb the selling pressure at $595 and push through $606 with a surge in volume, it will trigger short-covering. The immediate target would be the MA99 at $622. However, this requires a macro catalyst or a sudden spike in Binance ecosystem activity.
The Bearish Case (Higher Probability):
The current consolidation looks like a bear flag. If the price fails to hold the $580 support level, we will likely see a retest of the $566 low. If $566 breaks, the next major liquidity pool sits much lower, and the downtrend from $660 will officially resume.
Whale Activity & Market Sentiment
On-chain data and futures metrics suggest that smart money is not aggressively accumulating at these levels. Funding rates are neutral, and Open Interest is slowly bleeding off. This indicates that the market is waiting for a definitive move. Whales are likely placing limit orders at the extremes ($566 and below) rather than chasing the current chop.
Final Prediction & Strategy
Outlook: SIDEWAYS / BEARISH BIAS
For traders holding positions (especially those with a cost basis around $606), patience and strict risk management are required.
Do not average down blindly in a low-volume consolidation.
Watch the $580 level. A break below this invalidates the short-term bounce.
Watch the $606 level. A break above this is the first sign of life for the bulls.
The market does not owe you a recovery. Trade the chart in front of you, not the chart you want to see.
What is your take on BNB's current structure? Are you buying the dip or waiting for confirmation? Let me know in the comments!
#BNB #Binance #CryptoAnalysis #Trading #Altcoins
