$DOGE: When Lower Volume on a Pullback Is Actually a Bullish Clue
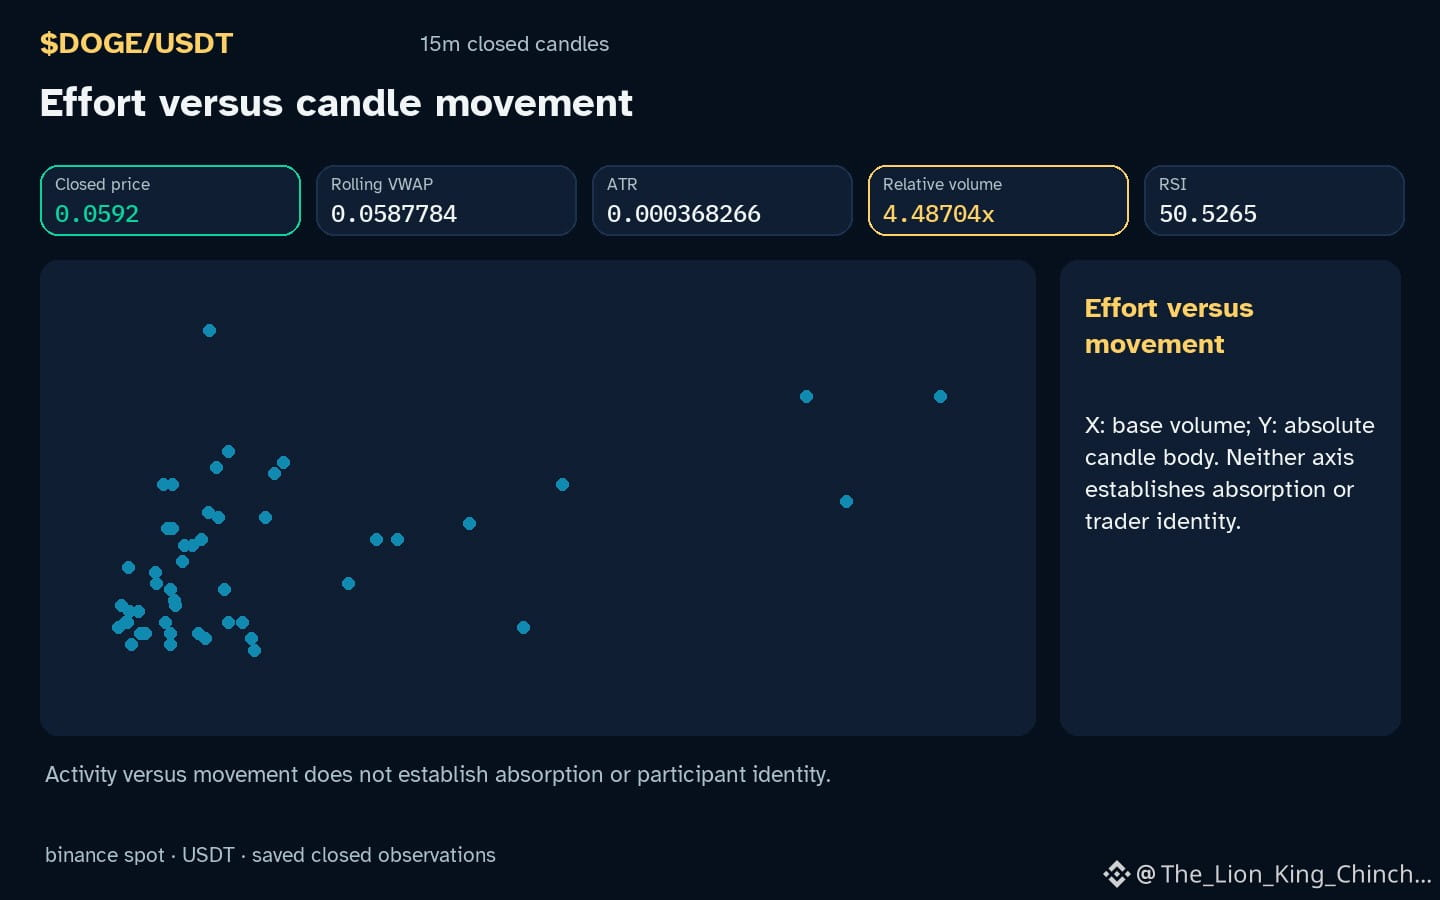
Does a drop in $DOGE signal panic or just a pause? The chart shows an hourly down move while volume sits 4.49x baseline. Many traders assume any decline with rising volume means aggressive selling is driving price lower. This misconception ignores the mechanism of constructive digestion. In a healthy market structure, corrective moves often see reduced participation because sellers are not chasing new lows aggressively. If volume were expected to expand during every pullback, consolidation phases would be impossible. Instead, lower volume on a down candle can indicate that the market is resting before the next directional move, not that sellers are overpowering buyers. The RSI reading of 50.5 provides context for momentum but does not confirm seller exhaustion. To reassess this interpretation, watch for the next closed candle. If price holds near 0.0585 without a significant volume spike, the digestion theory remains plausible. If price breaks below 0.0585 with sharp volume expansion, the aggressive selling scenario becomes stronger. This self-check distinguishes from assumptions based on candle shape alone. Candles and volume ratios alone cannot confirm motives or causation. The difference between these two scenarios matters for how you interpret local ranges.
Probabilistic market research, not a recommendation or guaranteed return.
A useful cross-check: $BTC has hourly direction down and volume not above its baseline; $RARE has hourly direction down and volume above its baseline. This alone does not establish correlation.
#DOGE #BTC
Does a drop in $DOGE signal panic or just a pause? The chart shows an hourly down move while volume sits 4.49x baseline. Many traders assume any decline with rising volume means aggressive selling is driving price lower. This misconception ignores the mechanism of constructive digestion. In a healthy market structure, corrective moves often see reduced participation because sellers are not chasing new lows aggressively. If volume were expected to expand during every pullback, consolidation phases would be impossible. Instead, lower volume on a down candle can indicate that the market is resting before the next directional move, not that sellers are overpowering buyers. The RSI reading of 50.5 provides context for momentum but does not confirm seller exhaustion. To reassess this interpretation, watch for the next closed candle. If price holds near 0.0585 without a significant volume spike, the digestion theory remains plausible. If price breaks below 0.0585 with sharp volume expansion, the aggressive selling scenario becomes stronger. This self-check distinguishes from assumptions based on candle shape alone. Candles and volume ratios alone cannot confirm motives or causation. The difference between these two scenarios matters for how you interpret local ranges.
Probabilistic market research, not a recommendation or guaranteed return.
A useful cross-check: $BTC has hourly direction down and volume not above its baseline; $RARE has hourly direction down and volume above its baseline. This alone does not establish correlation.
#DOGE #BTC