$BARD · 1H · Data as of 03:00 UTC, 16 Nov 2026
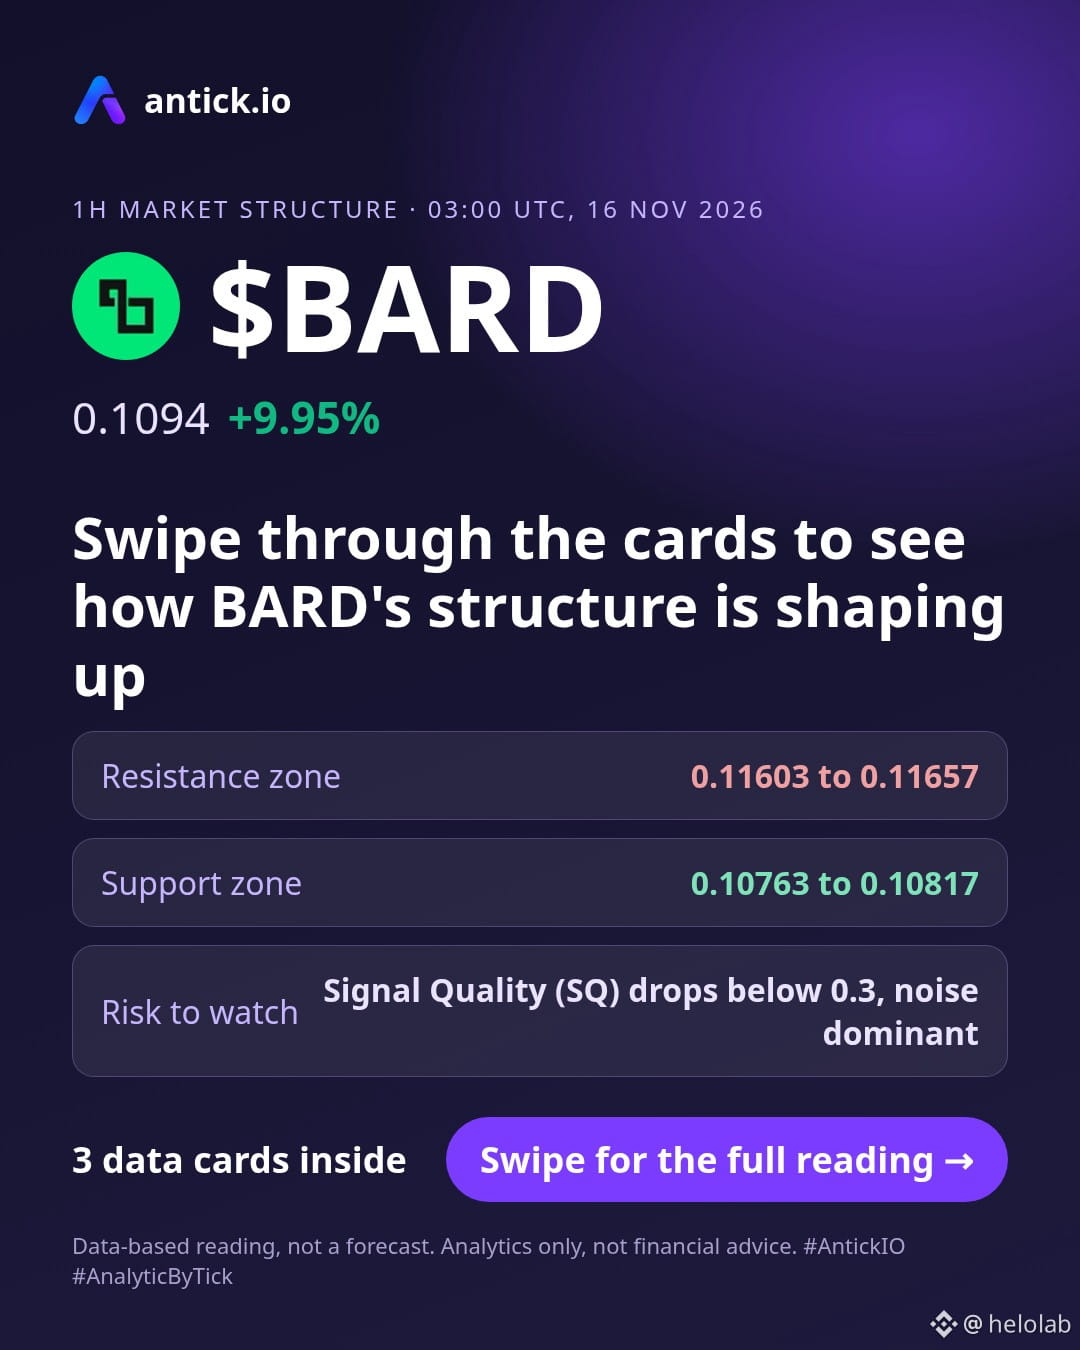
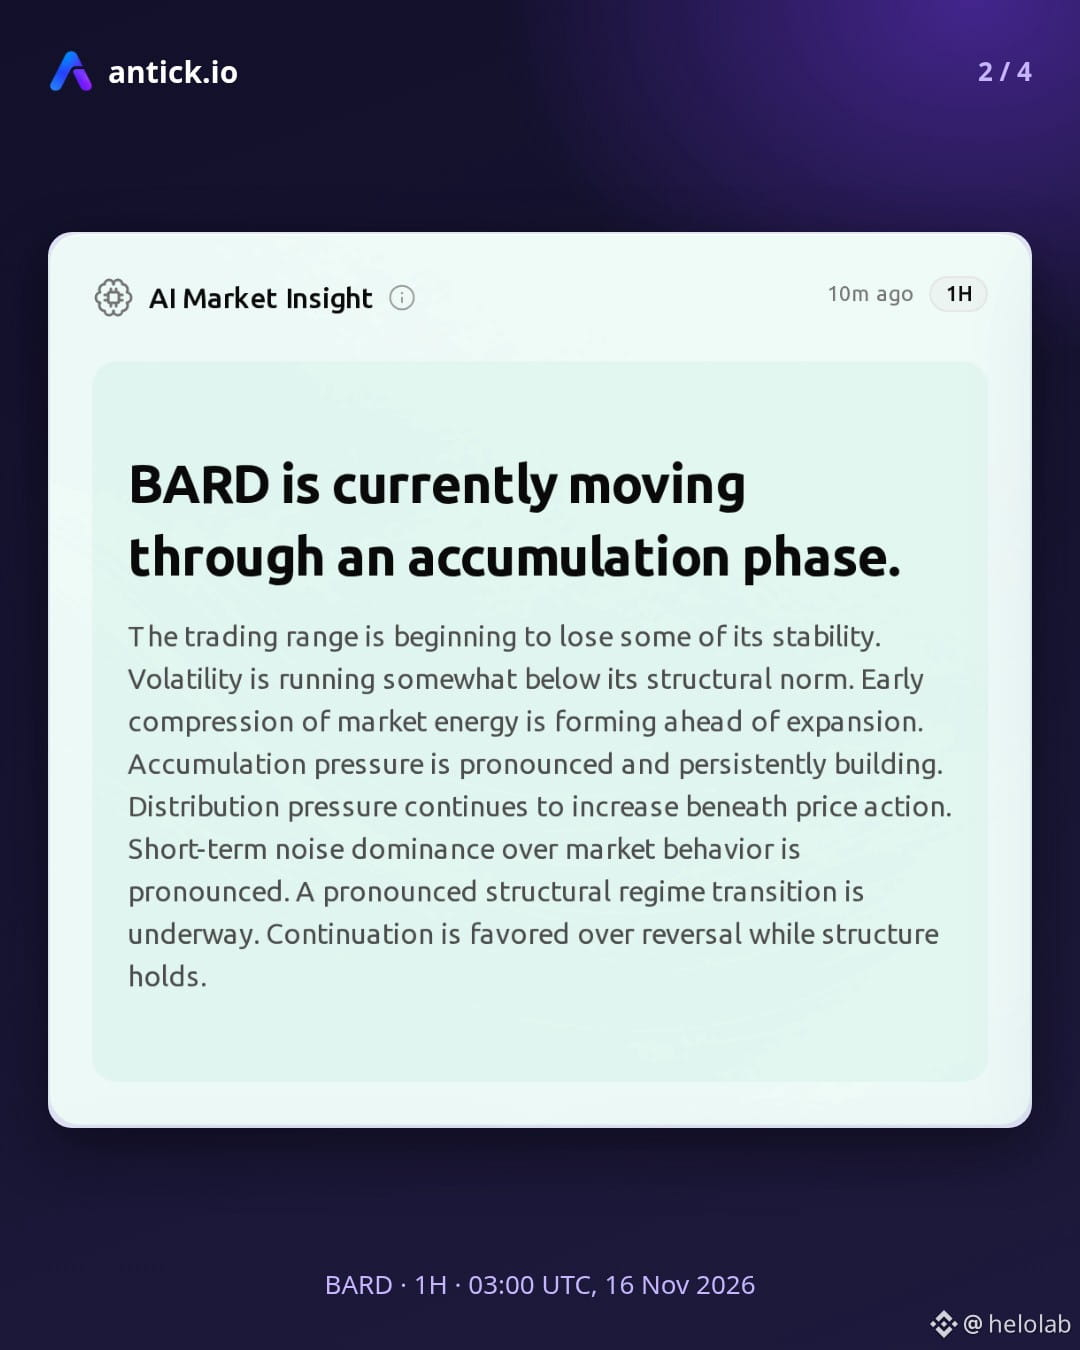
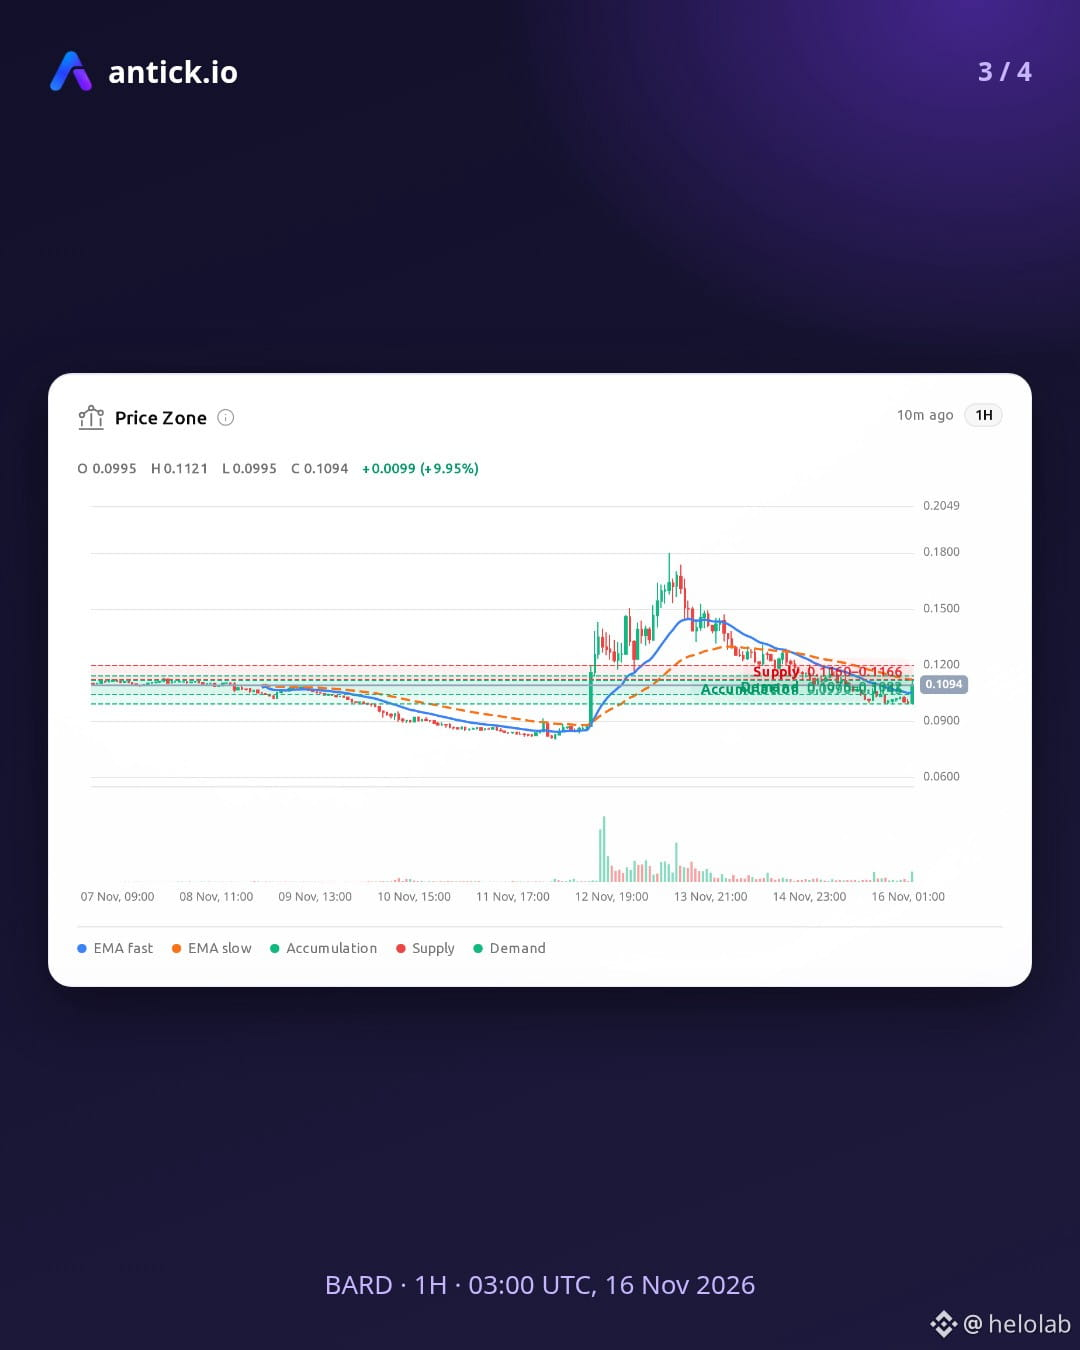
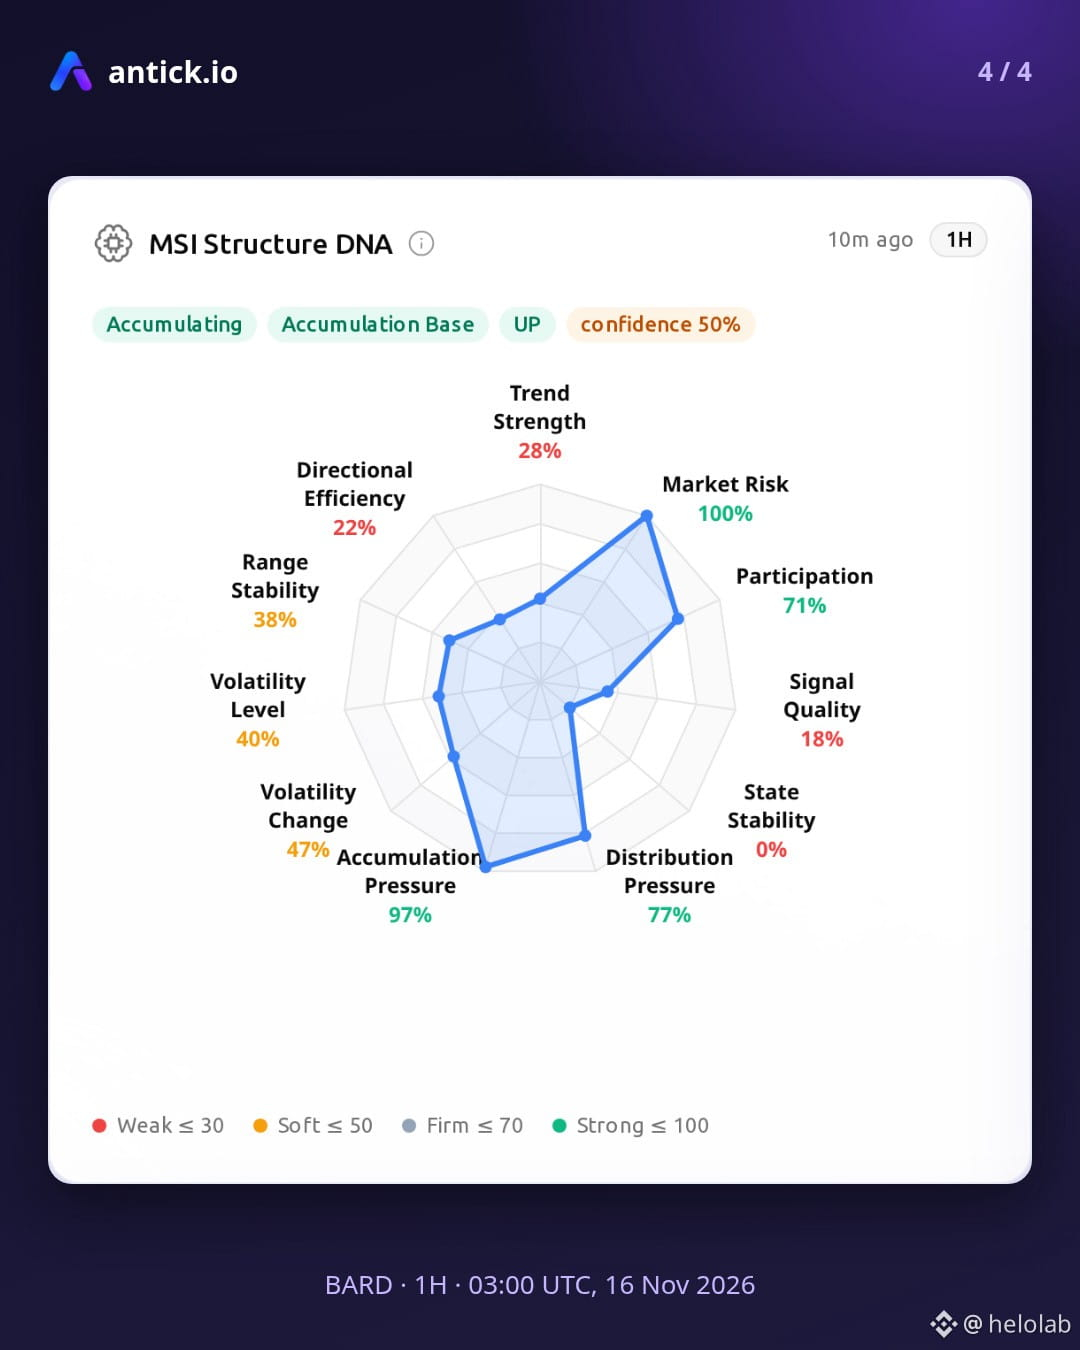
Is the accumulation showing in BARD a real base, or could it turn out to be a trap? A move higher is possible if the accumulation base that MSI shows breaking and the smart accumulation flagged by MPI keep building. A pullback lower is also possible if the trap risk on the pump signal and the noisy, unaligned movement noted by SCTA take over. The MSI Structure DNA card shows the accumulation reading in more detail.
Risk conditions:
- Signal Quality (SQ) drops below 0.3, noise dominant
- Distribution Pressure (DP) exceeds ±0.1
Invalidation zones:
- Upside reading weakens on a 1H close below 0.10763 to 0.10817
- Downside reading weakens on a 1H close above 0.11603 to 0.11657
Data-based reading, not a forecast. Analytics only, not financial advice.
$BARD #BARD #AntickIO #AnalyticByTick #OnChainData
Is the accumulation showing in BARD a real base, or could it turn out to be a trap? A move higher is possible if the accumulation base that MSI shows breaking and the smart accumulation flagged by MPI keep building. A pullback lower is also possible if the trap risk on the pump signal and the noisy, unaligned movement noted by SCTA take over. The MSI Structure DNA card shows the accumulation reading in more detail.
Risk conditions:
- Signal Quality (SQ) drops below 0.3, noise dominant
- Distribution Pressure (DP) exceeds ±0.1
Invalidation zones:
- Upside reading weakens on a 1H close below 0.10763 to 0.10817
- Downside reading weakens on a 1H close above 0.11603 to 0.11657
Data-based reading, not a forecast. Analytics only, not financial advice.
$BARD #BARD #AntickIO #AnalyticByTick #OnChainData