

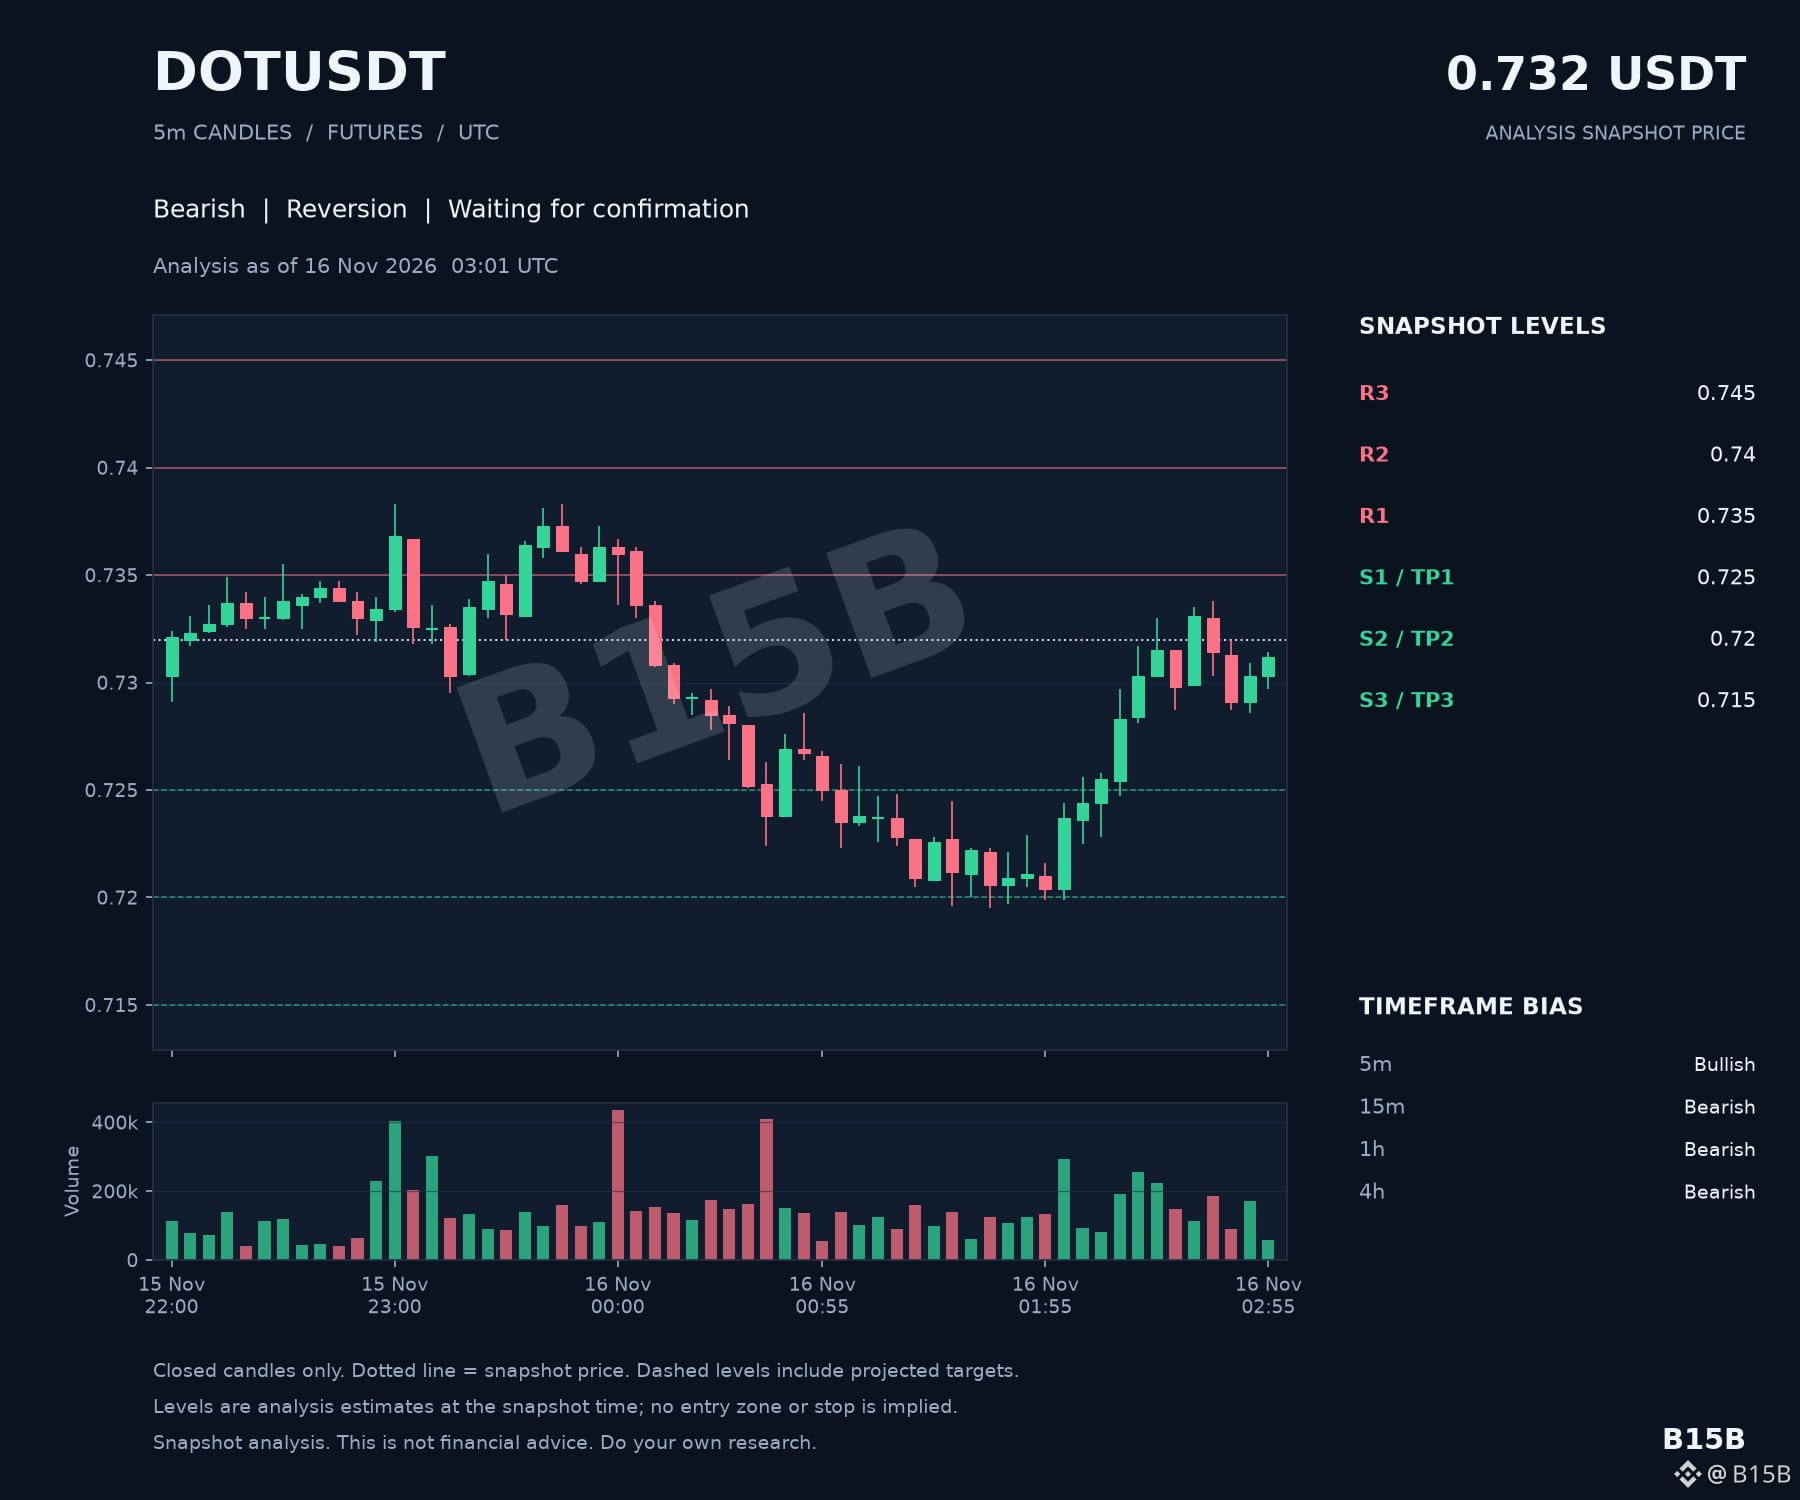
Watching $DOT right now reveals a classic technical conflict. While the 5-minute chart shows a flicker of bullishness, the 15-minute, hourly, and 4-hour timeframes are locked in a bearish trend. Currently at 0.732, the price is navigating toward the 0.735 resistance 🚧 while we wait for entry confirmation on a reversion setup ⏳. With support levels waiting at 0.725 and below 🧱, the weight of the higher timeframes is undeniable. When you see a single micro-timeframe turn bullish against a sea of red, what specific evidence do you look for to confirm it isn't just noise? 📉
Krypto-Nutzer weltweit auf Binance Square kennenlernen
⚡️ Bleib in Sachen Krypto stets am Puls.
💬 Die weltgrößte Kryptobörse vertraut darauf.
👍 Erhalte verlässliche Einblicke von verifizierten Creators.
E-Mail-Adresse/Telefonnummer