$QQQB : Why Same-Venue Comparisons Beat Mixing Prices From Different Exchanges
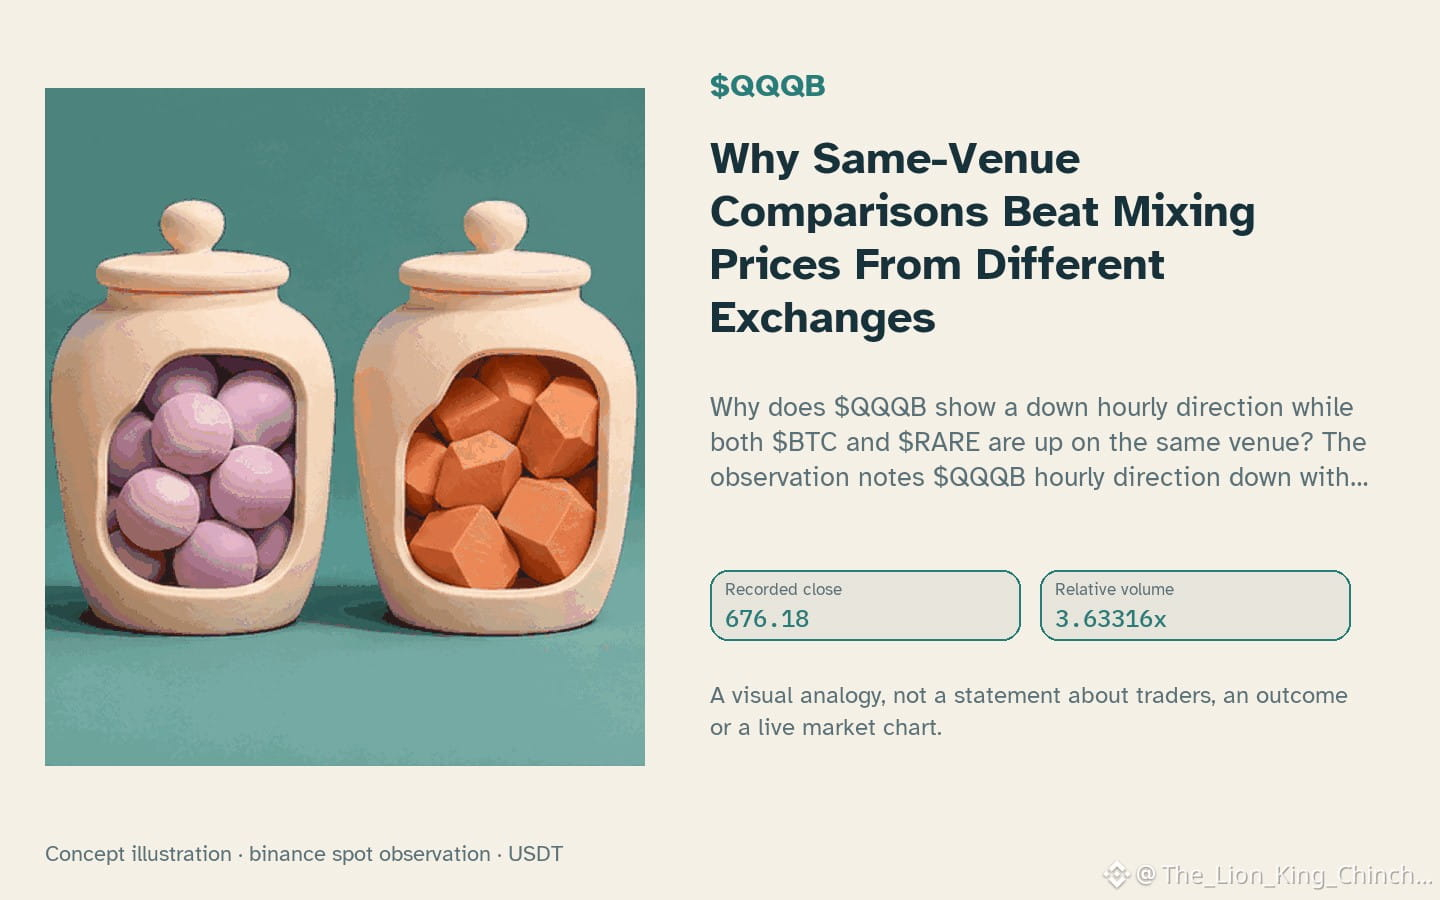
Why does $QQQB show a down hourly direction while both $BTC and $RARE are up on the same venue? The observation notes $QQQB hourly direction down with volume above baseline, contrasted with peer assets that share an up direction but lack elevated volume. This raises a data‑hygiene question: can we treat the shared direction as a meaningful signal, or does the differing volume structure undermine a joint interpretation?
A hypothetical decision framework treats each coin as an independent data stream. The hourly volume metric 3.63x baseline for $QQQB suggests heightened activity that may reflect a distinct market micro‑structure, whereas the peers’ volume sits at or below baseline, indicating a quieter backdrop. The RSI 45.1 provides a neutral momentum snapshot for $QQQB , further separating its short‑term bias from the peers.
Where the analogy helps is in reminding analysts to cleanly separate direction from intensity. A shared up trend does not guarantee a common driver; the volume divergence limits any inference of correlation. Where it fails is when one assumes that identical direction alone validates a combined forecast.
A self‑check would be to monitor the next closed hourly candle. If $QQQB ’s volume falls to baseline while the direction remains down, the earlier heightened‑volume hypothesis weakens. Conversely, if peers suddenly exhibit volume spikes, the shared‑direction narrative may gain credibility. This conditional reassessment keeps the analysis grounded in observable metrics without over‑reaching.
Probabilistic market research, not a recommendation or guaranteed return.
Watchlist contrast: $BTC has hourly direction up and volume not above its baseline; $RARE has hourly direction up and volume not above its baseline. This alone does not establish correlation.
#QQQB #BTC #RARE
Why does $QQQB show a down hourly direction while both $BTC and $RARE are up on the same venue? The observation notes $QQQB hourly direction down with volume above baseline, contrasted with peer assets that share an up direction but lack elevated volume. This raises a data‑hygiene question: can we treat the shared direction as a meaningful signal, or does the differing volume structure undermine a joint interpretation?
A hypothetical decision framework treats each coin as an independent data stream. The hourly volume metric 3.63x baseline for $QQQB suggests heightened activity that may reflect a distinct market micro‑structure, whereas the peers’ volume sits at or below baseline, indicating a quieter backdrop. The RSI 45.1 provides a neutral momentum snapshot for $QQQB , further separating its short‑term bias from the peers.
Where the analogy helps is in reminding analysts to cleanly separate direction from intensity. A shared up trend does not guarantee a common driver; the volume divergence limits any inference of correlation. Where it fails is when one assumes that identical direction alone validates a combined forecast.
A self‑check would be to monitor the next closed hourly candle. If $QQQB ’s volume falls to baseline while the direction remains down, the earlier heightened‑volume hypothesis weakens. Conversely, if peers suddenly exhibit volume spikes, the shared‑direction narrative may gain credibility. This conditional reassessment keeps the analysis grounded in observable metrics without over‑reaching.
Probabilistic market research, not a recommendation or guaranteed return.
Watchlist contrast: $BTC has hourly direction up and volume not above its baseline; $RARE has hourly direction up and volume not above its baseline. This alone does not establish correlation.
#QQQB #BTC #RARE