🔥 $ZEC Technical Update: Key Levels & Momentum Breakdown
📊 1. Market Snapshot
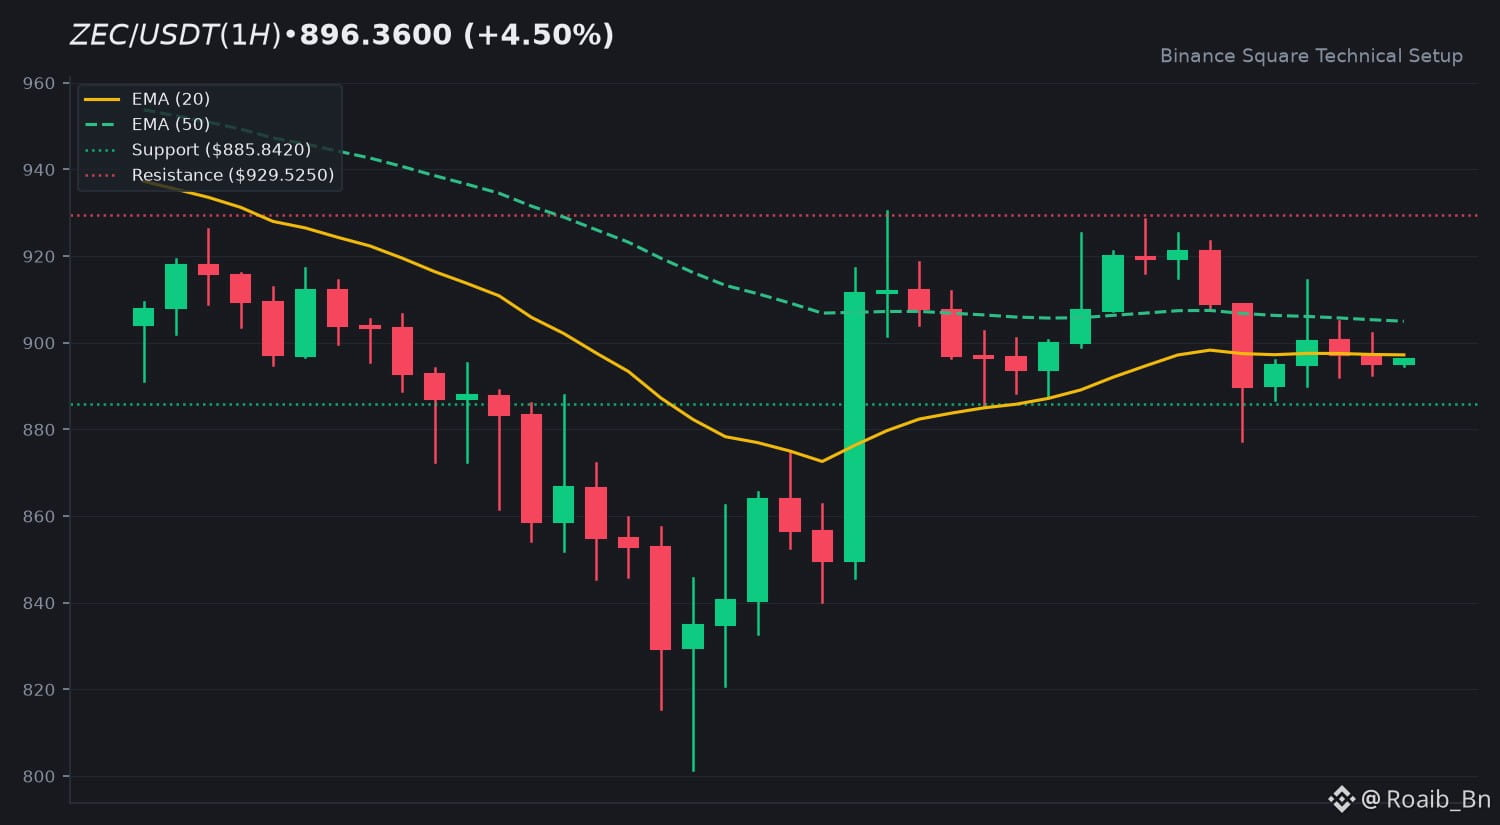
The asset $ZEC is currently trading at 896.3600 USDT, reflecting a 4.50 percent increase over the last 24 hours. The trading environment remains characterized by lower liquidity, with a 24h quote volume of approximately 202.9 million USDT. Price action has fluctuated between a daily high of 930.4900 and a low of 801.5200.
📈 2. Technical Momentum & Indicator Bias
Current price action for $ZEC sits just below the EMA 20 at 897.2151 and the EMA 50 at 904.9745, indicating a neutral to bearish posture as the price tests these dynamic averages. The RSI at 49.55 suggests a state of equilibrium, lacking clear directional momentum. The MACD histogram at -0.2145, with the MACD line beneath the signal line, points to ongoing consolidation rather than an immediate trend reversal.
🎯 3. Key Technical Levels to Watch
• 🟢 Resistance Zone: Initial resistance is positioned at 929.5250, with a secondary ceiling observed at 963.7175.
• 🔴 Support Zone: Immediate support rests at 885.8420, while the 24h low of 801.5200 remains the primary floor for downside testing.
• 🛡️ Pivot Confluence: The 897 range is critical as it aligns with the EMA 20.
💡 4. Technical Takeaway & Risk Management
The market bias for $ZEC remains cautious. Traders are monitoring the interaction between the current price and the EMA 20/50 cluster. A sustained move above these averages could signal a shift in short-term sentiment, while failure to hold the 885 support might lead to retesting lower liquidity zones.
💬 5. Community Discussion
What is your technical outlook for $ZEC this week? Are you accumulating or waiting for confirmation? Drop your thoughts below! 👇
⚠️ 6. Disclaimer
Educational technical analysis only. Not financial advice (NFA). Crypto markets involve risk. Always DYOR.
$ZEC #ZEC #BinanceSquare
📊 1. Market Snapshot
The asset $ZEC is currently trading at 896.3600 USDT, reflecting a 4.50 percent increase over the last 24 hours. The trading environment remains characterized by lower liquidity, with a 24h quote volume of approximately 202.9 million USDT. Price action has fluctuated between a daily high of 930.4900 and a low of 801.5200.
📈 2. Technical Momentum & Indicator Bias
Current price action for $ZEC sits just below the EMA 20 at 897.2151 and the EMA 50 at 904.9745, indicating a neutral to bearish posture as the price tests these dynamic averages. The RSI at 49.55 suggests a state of equilibrium, lacking clear directional momentum. The MACD histogram at -0.2145, with the MACD line beneath the signal line, points to ongoing consolidation rather than an immediate trend reversal.
🎯 3. Key Technical Levels to Watch
• 🟢 Resistance Zone: Initial resistance is positioned at 929.5250, with a secondary ceiling observed at 963.7175.
• 🔴 Support Zone: Immediate support rests at 885.8420, while the 24h low of 801.5200 remains the primary floor for downside testing.
• 🛡️ Pivot Confluence: The 897 range is critical as it aligns with the EMA 20.
💡 4. Technical Takeaway & Risk Management
The market bias for $ZEC remains cautious. Traders are monitoring the interaction between the current price and the EMA 20/50 cluster. A sustained move above these averages could signal a shift in short-term sentiment, while failure to hold the 885 support might lead to retesting lower liquidity zones.
💬 5. Community Discussion
What is your technical outlook for $ZEC this week? Are you accumulating or waiting for confirmation? Drop your thoughts below! 👇
⚠️ 6. Disclaimer
Educational technical analysis only. Not financial advice (NFA). Crypto markets involve risk. Always DYOR.
$ZEC #ZEC #BinanceSquare