$BTC: When Data Gaps Exist, How Should Analysts Respond?
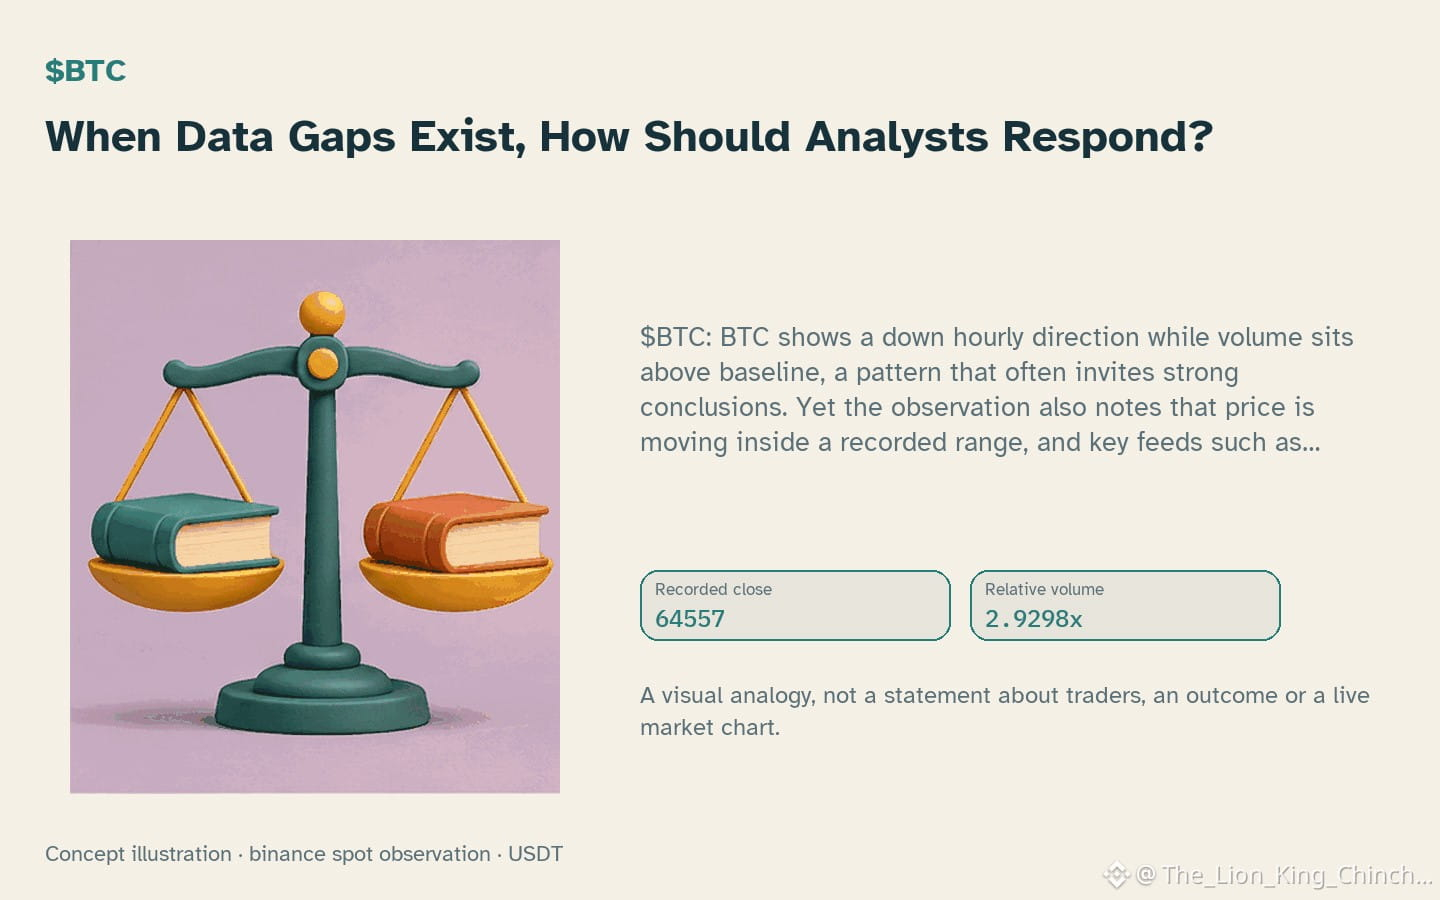
$BTC: BTC shows a down hourly direction while volume sits above baseline, a pattern that often invites strong conclusions. Yet the observation also notes that price is moving inside a recorded range, and key feeds such as open interest or funding rates are missing. How can a community maintain confidence without over‑reaching on limited evidence?
One way to think about the gap is as a "transparency test." When on‑chain or funding data are unavailable, the analyst can lean on the metrics that are present: relative volume 2.93x baseline and RSI 39.5. A high relative volume may suggest heightened participation, but without complementary data it cannot prove buying or selling pressure. Similarly, an RSI reading can hint at overbought or oversold conditions, yet it does not reveal why participants are acting.
A practical self‑check is to ask: if the next closed hourly candle shows a neutral change -0.230303% and the RSI moves back toward a middle range, the earlier interpretation loses strength. Conversely, a sustained move outside the range paired with a shift in volume would reinforce the initial view. This conditional approach separates what the data actually show from the story we might be tempted to tell.
The broader dilemma is whether analysts should claim more confidence or openly flag the limitations. By labeling missing feeds as a transparency gap, writers can invite disagreement without resorting to hype, and readers can learn to weigh evidence against speculation.
Probabilistic market research, not a recommendation or guaranteed return.
The comparison to keep in mind: $BARD has hourly direction down and volume not above its baseline; $FF has hourly direction down and volume above its baseline. This alone does not establish correlation.
#BTC #BARD #FF
$BTC: BTC shows a down hourly direction while volume sits above baseline, a pattern that often invites strong conclusions. Yet the observation also notes that price is moving inside a recorded range, and key feeds such as open interest or funding rates are missing. How can a community maintain confidence without over‑reaching on limited evidence?
One way to think about the gap is as a "transparency test." When on‑chain or funding data are unavailable, the analyst can lean on the metrics that are present: relative volume 2.93x baseline and RSI 39.5. A high relative volume may suggest heightened participation, but without complementary data it cannot prove buying or selling pressure. Similarly, an RSI reading can hint at overbought or oversold conditions, yet it does not reveal why participants are acting.
A practical self‑check is to ask: if the next closed hourly candle shows a neutral change -0.230303% and the RSI moves back toward a middle range, the earlier interpretation loses strength. Conversely, a sustained move outside the range paired with a shift in volume would reinforce the initial view. This conditional approach separates what the data actually show from the story we might be tempted to tell.
The broader dilemma is whether analysts should claim more confidence or openly flag the limitations. By labeling missing feeds as a transparency gap, writers can invite disagreement without resorting to hype, and readers can learn to weigh evidence against speculation.
Probabilistic market research, not a recommendation or guaranteed return.
The comparison to keep in mind: $BARD has hourly direction down and volume not above its baseline; $FF has hourly direction down and volume above its baseline. This alone does not establish correlation.
#BTC #BARD #FF