$BFUSD: Confusing High Activity With High Productivity
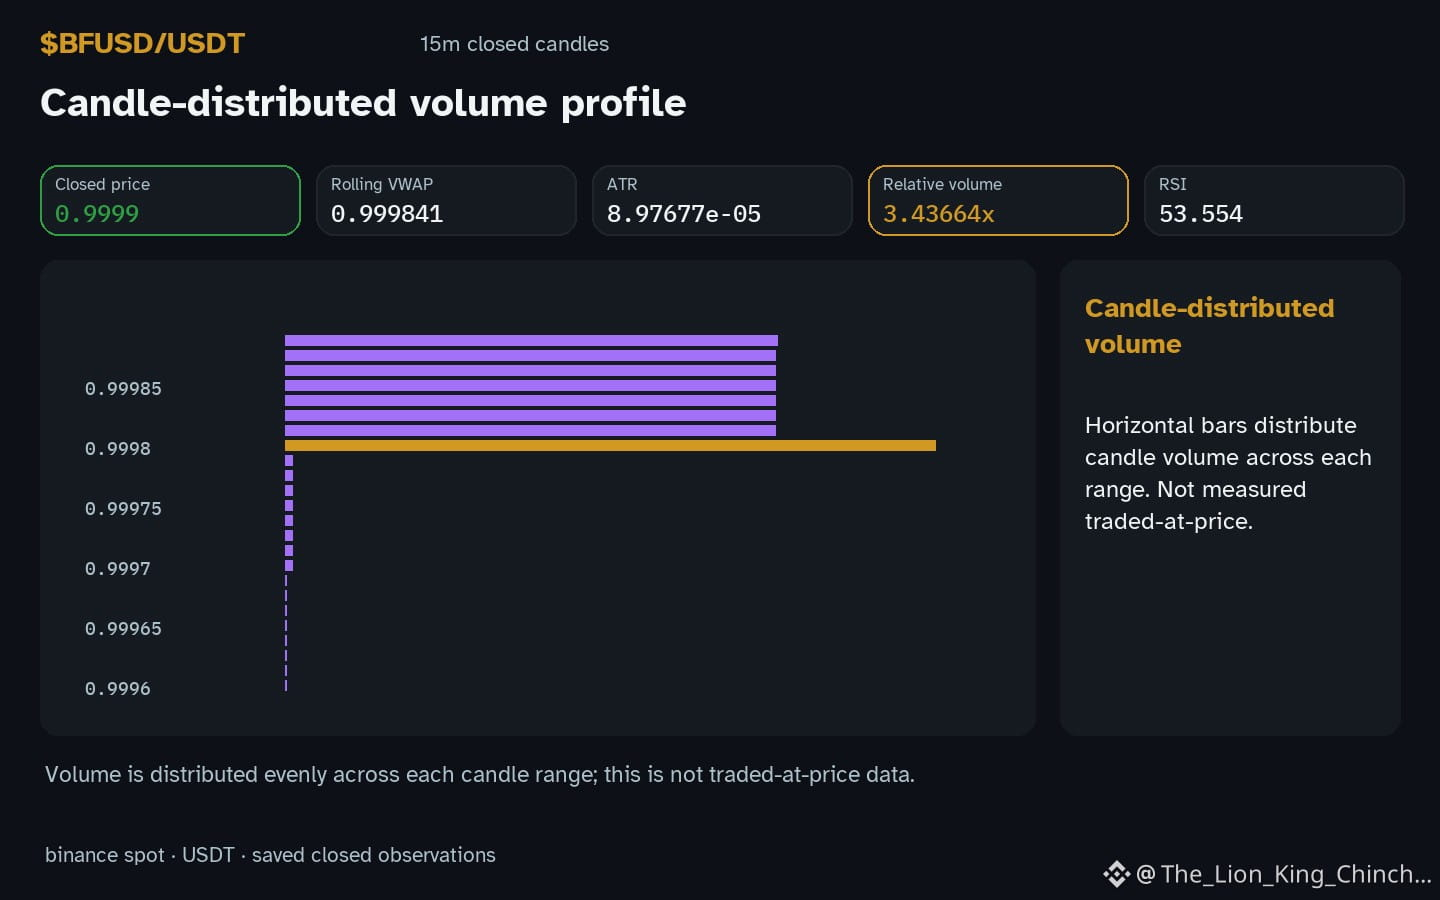
The ticker $BFUSD shows an hourly up direction while volume sits 3.44x baseline. This snapshot invites a question: does the flurry of trades signal genuine market strength or simply a false badge of effort?
A common assumption is that high activity equals higher probability of profit. The bias at play is over‑trading, where the desire to act repeatedly can be driven by attention and the feeling of productivity. Traders may interpret the busy chart as a cue to add positions, even when the price is merely moving inside a recorded range and the RSI 53.6 does not indicate an extreme condition.
A counterexample would be a calm market where price stalls despite similar volume, showing that activity alone does not guarantee momentum. In our observation, the price remains within local support 0.9998 and resistance 0.9999, suggesting limited directional pressure.
To test the bias, perform a self‑check: after spotting high volume, pause and ask whether the next trade adds strategic value or merely satisfies the urge to be active. If the answer leans toward the latter, consider scaling back and waiting for a clearer signal such as a break beyond the recorded range.
Future evidence that could weaken this reading includes a sustained breakout beyond the local range accompanied by a decisive shift in RSI 53.6. Until then, treat volume spikes as a cue for reflection rather than a mandate to trade. 😊
Probabilistic market research, not a recommendation or guaranteed return.
#BFUSD #TradingPsychology #CryptoLearning
The ticker $BFUSD shows an hourly up direction while volume sits 3.44x baseline. This snapshot invites a question: does the flurry of trades signal genuine market strength or simply a false badge of effort?
A common assumption is that high activity equals higher probability of profit. The bias at play is over‑trading, where the desire to act repeatedly can be driven by attention and the feeling of productivity. Traders may interpret the busy chart as a cue to add positions, even when the price is merely moving inside a recorded range and the RSI 53.6 does not indicate an extreme condition.
A counterexample would be a calm market where price stalls despite similar volume, showing that activity alone does not guarantee momentum. In our observation, the price remains within local support 0.9998 and resistance 0.9999, suggesting limited directional pressure.
To test the bias, perform a self‑check: after spotting high volume, pause and ask whether the next trade adds strategic value or merely satisfies the urge to be active. If the answer leans toward the latter, consider scaling back and waiting for a clearer signal such as a break beyond the recorded range.
Future evidence that could weaken this reading includes a sustained breakout beyond the local range accompanied by a decisive shift in RSI 53.6. Until then, treat volume spikes as a cue for reflection rather than a mandate to trade. 😊
Probabilistic market research, not a recommendation or guaranteed return.
#BFUSD #TradingPsychology #CryptoLearning