$SHIB: Understanding VWAP Without Magic Thinking
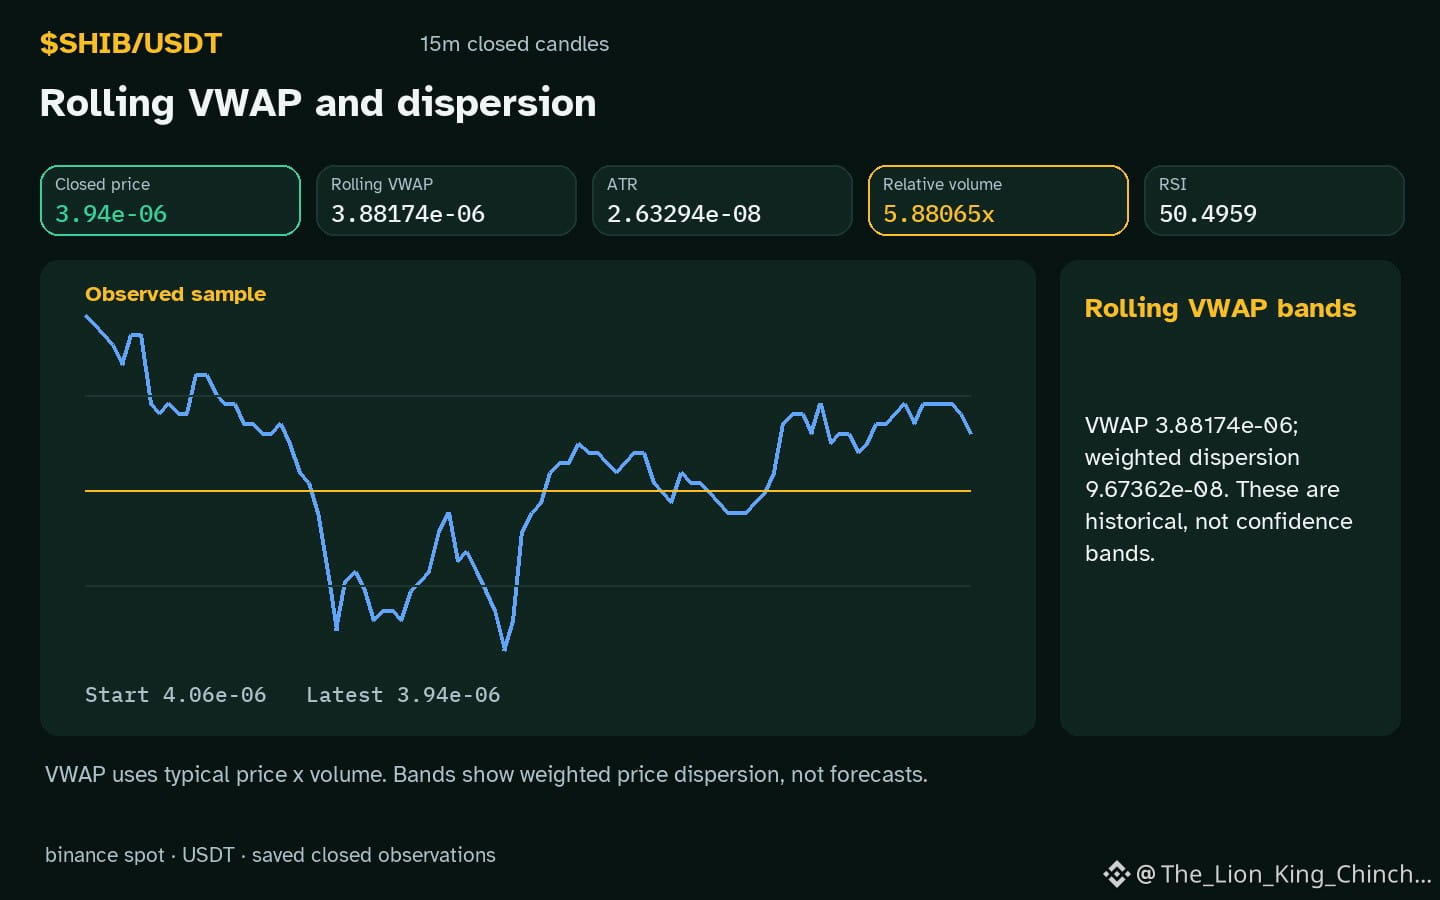
The $SHIB chart shows an hourly down direction while volume sits above baseline, prompting a basic question: does the volume‑weighted average price act like a magnet? In my imaginary research notebook I often imagine a hamster on a treadmill trying to chase a moving target – the VWAP line moves with each trade, yet the hamster never catches it because the treadmill itself is powered by the same trades. This metaphor reminds us that VWAP is simply a statistical average: the total traded value divided by total volume over a chosen window. It does not guarantee any bounce, nor does it reveal hidden intent.
One useful way to think about VWAP is to treat it as a reference point for price efficiency. If price sits noticeably above the VWAP while relative volume is 5.88x baseline, a trader might ask whether the market is overpaying for the asset in that interval. Conversely, if price lags far below VWAP, the same metric could suggest a temporary discount. The current observation of hourly decline and a modest RSI 50.5 leaves both scenarios open.
A self‑check can help. Should the next closed candle show a daily change -3.90244% that narrows the gap to VWAP, the earlier hypothesis of a price‑inefficiency loses weight. If the gap widens, the VWAP reference remains a useful sanity check, but still without any guarantee of direction.
Probabilistic market research, not a recommendation or guaranteed return.
#SHIB #LearnCrypto #CryptoLearning
The $SHIB chart shows an hourly down direction while volume sits above baseline, prompting a basic question: does the volume‑weighted average price act like a magnet? In my imaginary research notebook I often imagine a hamster on a treadmill trying to chase a moving target – the VWAP line moves with each trade, yet the hamster never catches it because the treadmill itself is powered by the same trades. This metaphor reminds us that VWAP is simply a statistical average: the total traded value divided by total volume over a chosen window. It does not guarantee any bounce, nor does it reveal hidden intent.
One useful way to think about VWAP is to treat it as a reference point for price efficiency. If price sits noticeably above the VWAP while relative volume is 5.88x baseline, a trader might ask whether the market is overpaying for the asset in that interval. Conversely, if price lags far below VWAP, the same metric could suggest a temporary discount. The current observation of hourly decline and a modest RSI 50.5 leaves both scenarios open.
A self‑check can help. Should the next closed candle show a daily change -3.90244% that narrows the gap to VWAP, the earlier hypothesis of a price‑inefficiency loses weight. If the gap widens, the VWAP reference remains a useful sanity check, but still without any guarantee of direction.
Probabilistic market research, not a recommendation or guaranteed return.
#SHIB #LearnCrypto #CryptoLearning