$ETH $BTC $SOL
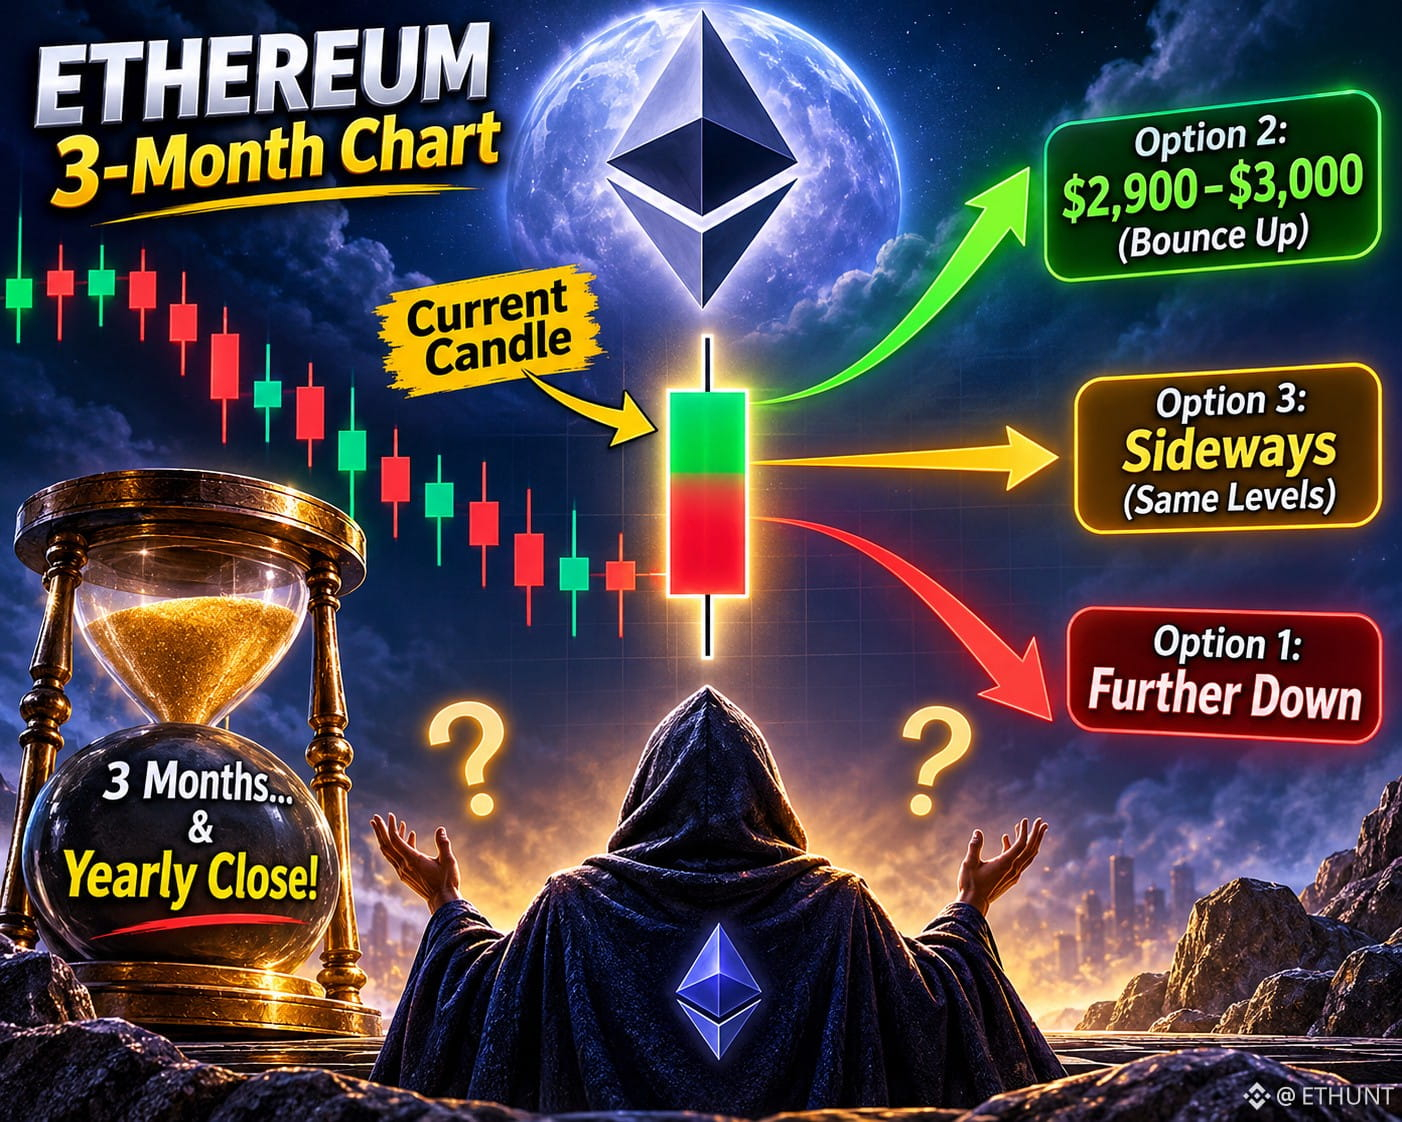
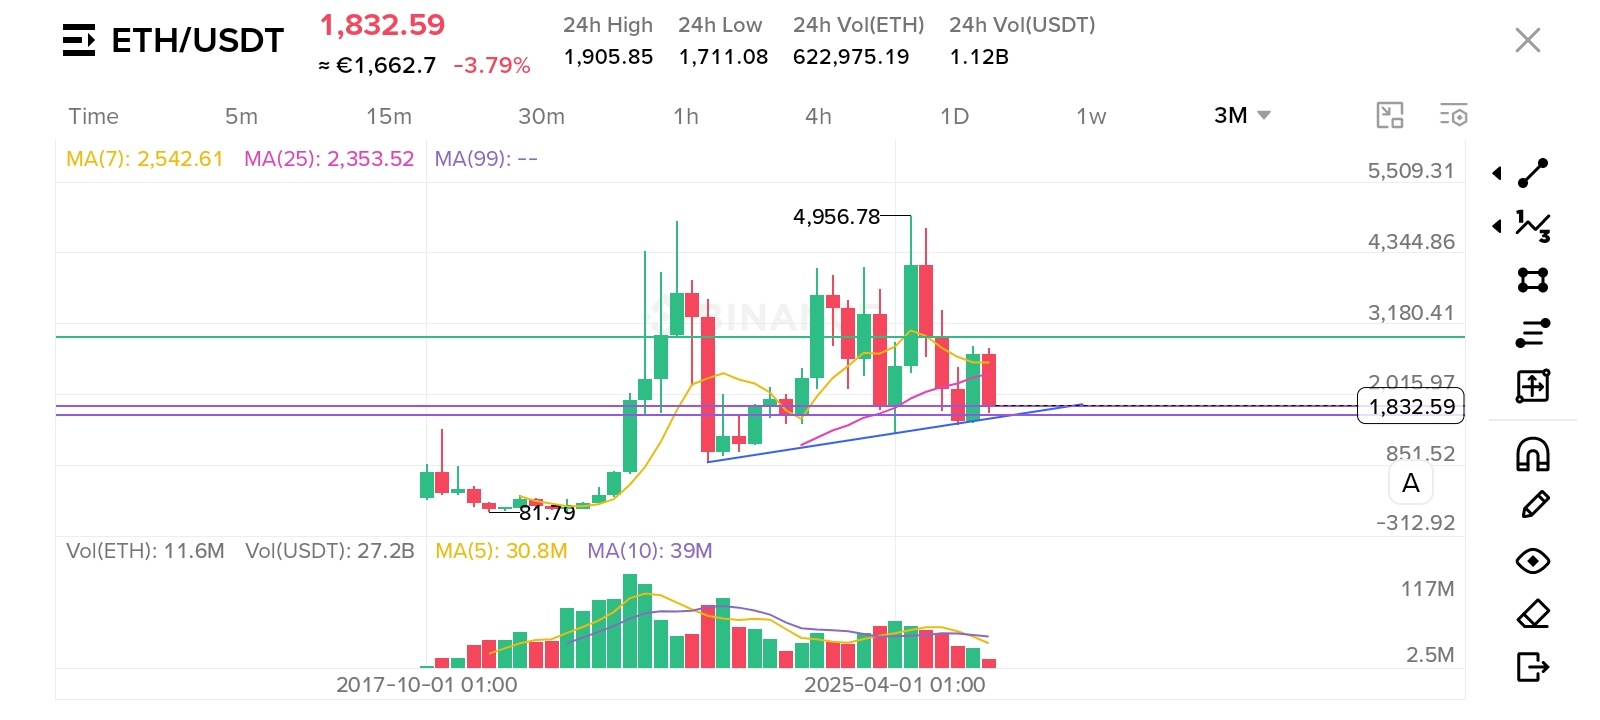
This is the 3-month Ethereum chart, meaning each candle represents a period of three months.
We're now halfway through the current candle, which I believe is the most important and potentially dangerous one, because its close will mark not only the end of a 3-month period but also the yearly close.
Where do you think this candle will close? At what price level?
I'd love for all my friends and fellow traders to engage with this post and leave a comment. It will only take you two seconds!
Option 1: It will continue moving down. Comment (1).
Option 2: It will reverse and move back up. Comment (2).
Option 3: It will stay within the same price range. Comment (3).
As for me, I'm going with Option (2). I believe ETH will bounce back toward the $2,900–$3,000 levels!!
Thank you all for your support! ❤️
#TradingCommunity #TradingSignals #TradingIdeas #Ethereum #ETHUNT
This is the 3-month Ethereum chart, meaning each candle represents a period of three months.
We're now halfway through the current candle, which I believe is the most important and potentially dangerous one, because its close will mark not only the end of a 3-month period but also the yearly close.
Where do you think this candle will close? At what price level?
I'd love for all my friends and fellow traders to engage with this post and leave a comment. It will only take you two seconds!
Option 1: It will continue moving down. Comment (1).
Option 2: It will reverse and move back up. Comment (2).
Option 3: It will stay within the same price range. Comment (3).
As for me, I'm going with Option (2). I believe ETH will bounce back toward the $2,900–$3,000 levels!!
Thank you all for your support! ❤️
#TradingCommunity #TradingSignals #TradingIdeas #Ethereum #ETHUNT