HAS BTC REALLY FOUND ITS BOTTOM? OR ARE WE TOO QUICK TO BELIEVE WHAT THE CHART IS TELLING US?
Looking at the BTCUSDT 1D chart, everything seems to be falling into place.
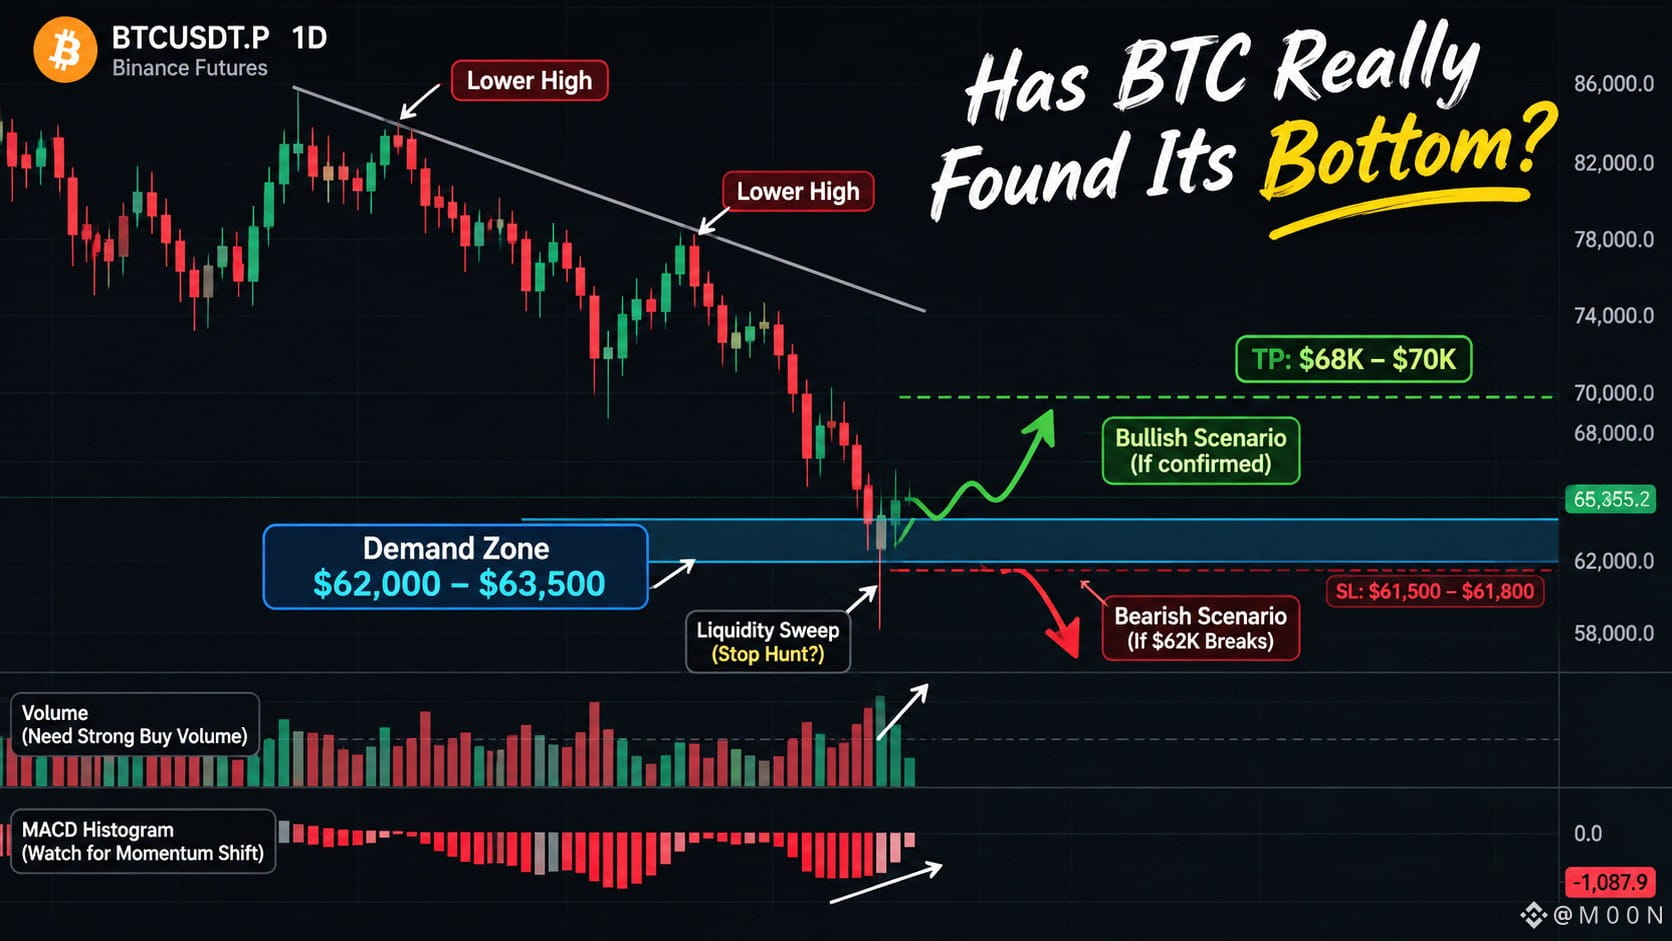
A clear Demand Zone around $62,000–$63,500. A liquidity sweep followed by a slight rejection. Historical support, deeply negative MACD momentum, and early expectations of a bullish reversal.
From a textbook perspective, this looks like a potential bottom.
The LONG scenario is straightforward:
Hold above $62,000.
Print a bullish daily candle with strong volume.
MACD histogram starts contracting.
H4/H1 forms a Higher Low.
Break the bearish structure and successfully retest it.
Sounds convincing, doesn't it?
But I have a different perspective.
If everyone can see the same support zone and the same potential reversal, does that automatically make it a good opportunity?
I am not questioning the $62,000–$63,500 Demand Zone. I am questioning whether it will actually hold.
What if this is just a relief rally within a larger downtrend? What if $62,000 breaks and all those early buyers become trapped?
A visible support zone doesn't guarantee a reversal.
A long lower wick is not a bottom. A Demand Zone is not a bottom. Even a contracting MACD histogram isn't enough to confirm a trend reversal.
I want the market to prove that buyers are taking control, rather than convincing myself that Bitcoin is simply cheap enough to buy.
Sometimes, the best opportunity isn't buying the exact bottom. It's having enough patience to recognize when the market has actually stopped falling.
I remain skeptical.
Is BTC preparing to establish a bottom around $62,000, or is this just another relief rally before lower prices?
I don't want to be right simply because I'm LONG. I want to go LONG when the market gives me enough evidence.
#BTC #Bitcoin #TradingPsychology
Looking at the BTCUSDT 1D chart, everything seems to be falling into place.
A clear Demand Zone around $62,000–$63,500. A liquidity sweep followed by a slight rejection. Historical support, deeply negative MACD momentum, and early expectations of a bullish reversal.
From a textbook perspective, this looks like a potential bottom.
The LONG scenario is straightforward:
Hold above $62,000.
Print a bullish daily candle with strong volume.
MACD histogram starts contracting.
H4/H1 forms a Higher Low.
Break the bearish structure and successfully retest it.
Sounds convincing, doesn't it?
But I have a different perspective.
If everyone can see the same support zone and the same potential reversal, does that automatically make it a good opportunity?
I am not questioning the $62,000–$63,500 Demand Zone. I am questioning whether it will actually hold.
What if this is just a relief rally within a larger downtrend? What if $62,000 breaks and all those early buyers become trapped?
A visible support zone doesn't guarantee a reversal.
A long lower wick is not a bottom. A Demand Zone is not a bottom. Even a contracting MACD histogram isn't enough to confirm a trend reversal.
I want the market to prove that buyers are taking control, rather than convincing myself that Bitcoin is simply cheap enough to buy.
Sometimes, the best opportunity isn't buying the exact bottom. It's having enough patience to recognize when the market has actually stopped falling.
I remain skeptical.
Is BTC preparing to establish a bottom around $62,000, or is this just another relief rally before lower prices?
I don't want to be right simply because I'm LONG. I want to go LONG when the market gives me enough evidence.
#BTC #Bitcoin #TradingPsychology