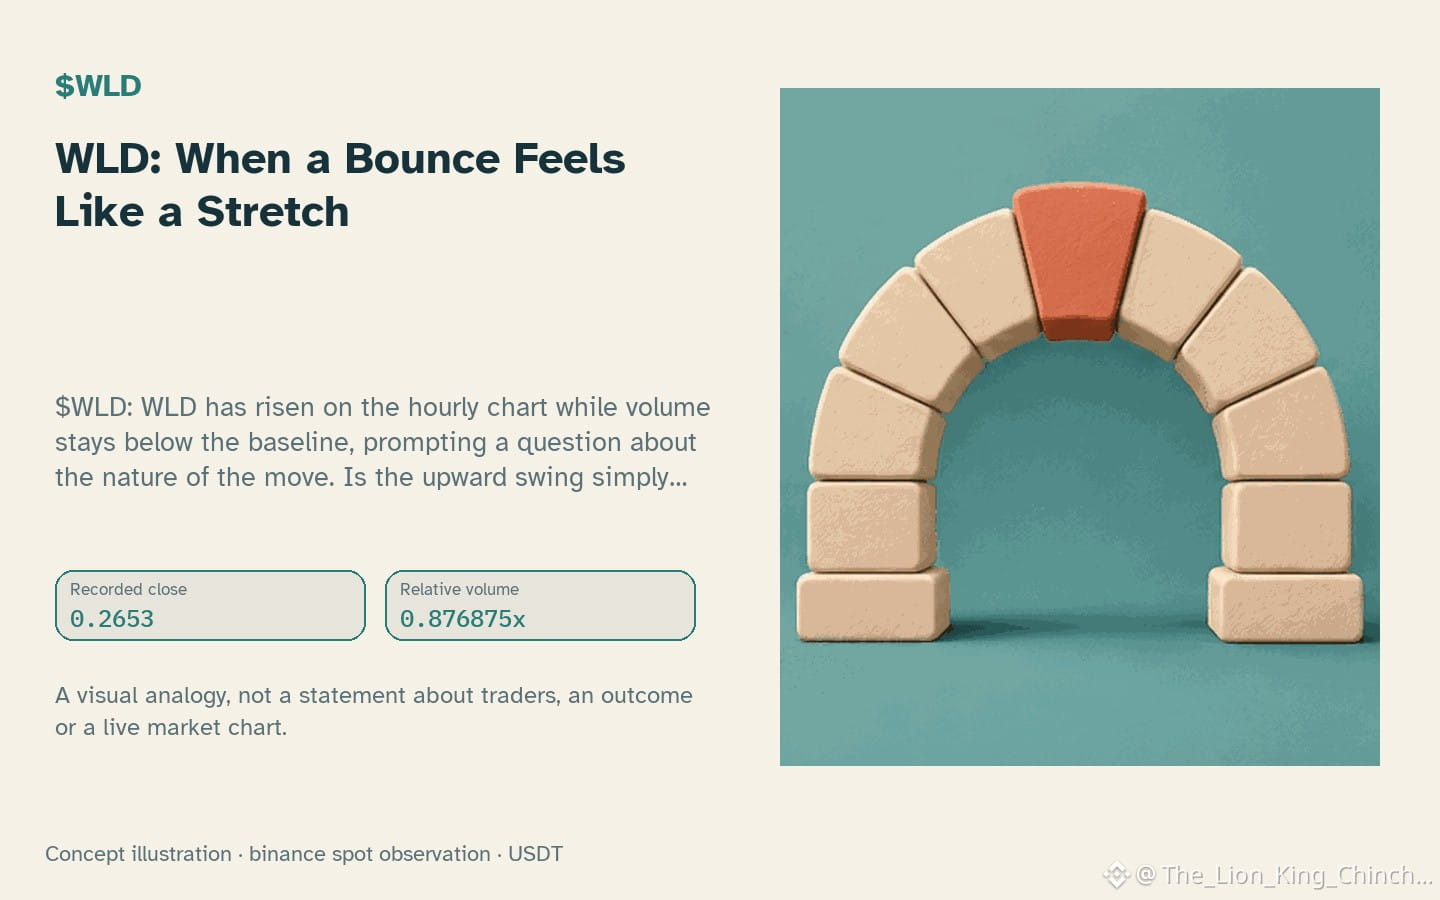
$WLD: WLD: When a Bounce Feels Like a Stretch
$WLD: WLD has risen on the hourly chart while volume stays below the baseline, prompting a question about the nature of the move. Is the upward swing simply an elastic pullback that will snap back, or does it hint at a structural break in the price path?
An elastic pullback works like a rubber band stretched over a peg. The price moves away from a recent high, but the market’s underlying liquidity still prefers the previous range, so a modest reversal is likely once the tension eases. In contrast, a structural break resembles snapping the band; the price clears a key resistance level and the order flow shifts enough to create a new trading zone.
To test the hypothesis, compare two simple signals. First, the relative volume metric 0.88x baseline shows whether buying interest is strong enough to support a break. A value close to one suggests the bounce may be elastic. Second, the RSI reading 62.2 indicates how far price has moved from its recent mean; a neutral value supports the elastic view, while an extreme reading could point toward a new equilibrium.
A counterexample would be a scenario where volume spikes above baseline and RSI moves into overbought territory, weakening the elastic interpretation. Future closed‑hour candles that show sustained volume above baseline and a rising RSI would prompt a reassessment toward a structural break. Until then, treat the move as a hypothesis rather than a certainty.
Probabilistic market research, not a recommendation or guaranteed return.
#WLD #CryptoEducation
$WLD: WLD has risen on the hourly chart while volume stays below the baseline, prompting a question about the nature of the move. Is the upward swing simply an elastic pullback that will snap back, or does it hint at a structural break in the price path?
An elastic pullback works like a rubber band stretched over a peg. The price moves away from a recent high, but the market’s underlying liquidity still prefers the previous range, so a modest reversal is likely once the tension eases. In contrast, a structural break resembles snapping the band; the price clears a key resistance level and the order flow shifts enough to create a new trading zone.
To test the hypothesis, compare two simple signals. First, the relative volume metric 0.88x baseline shows whether buying interest is strong enough to support a break. A value close to one suggests the bounce may be elastic. Second, the RSI reading 62.2 indicates how far price has moved from its recent mean; a neutral value supports the elastic view, while an extreme reading could point toward a new equilibrium.
A counterexample would be a scenario where volume spikes above baseline and RSI moves into overbought territory, weakening the elastic interpretation. Future closed‑hour candles that show sustained volume above baseline and a rising RSI would prompt a reassessment toward a structural break. Until then, treat the move as a hypothesis rather than a certainty.
Probabilistic market research, not a recommendation or guaranteed return.
#WLD #CryptoEducation