⚠️ WARNING: Do NOT Catch This Falling Knife Until You See This Critical Level! ⚠️
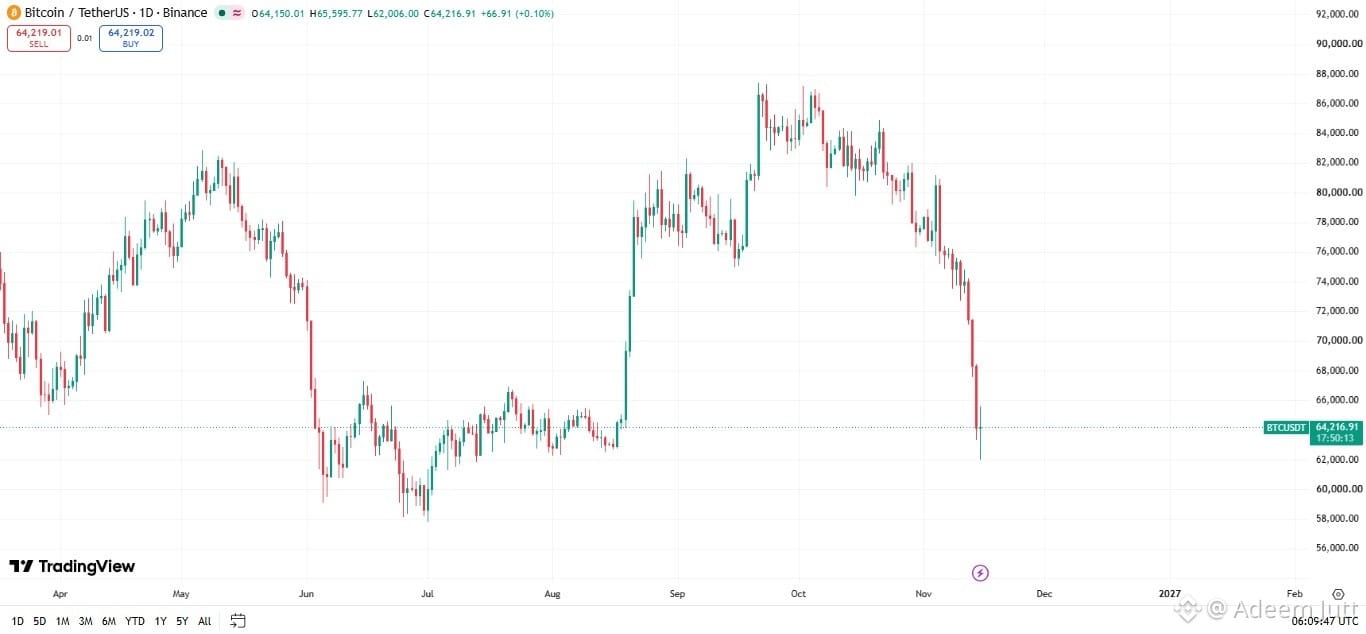
$BTC is currently experiencing a severe bearish momentum, as seen on the daily chart. After a strong rejection from the $86,000 region, the price has aggressively printed multiple large red candles, erasing weeks of gains and dropping sharply to the $64,000 level.
Key Levels to Watch:
📉 Immediate Support (Demand Zone): $60,000 - $64,000
If we look to the left, this current price zone acted as a massive accumulation and support base in June and July. The price is currently testing the upper boundary of this historical demand zone.
📈 Immediate Resistance: $70,000 - $72,000
Any relief rally will first face heavy resistance here. The price would need to reclaim this area to invalidate the current short-term bearish structure.
🔴 Bearish Case:
The momentum is clearly downward. If the daily candle closes firmly below $62,000, the next logical liquidity grab could be down toward the $58,000 - $56,000 range.
🟢 Bullish Case (Relief Rally):
A bounce from this historical support zone is highly probable. If we see a bullish reversal candle (like a hammer or a strong engulfing) forming around $64,000, we could see a short-term relief rally back up to retest $68,000 - $70,000.
💡 Professional Advice:
Right now, patience is key. Do not try to catch a falling knife. Wait for price action confirmation such as a daily close above the previous support or a clear rejection wick before opening a position. Always use strict stop-losses and manage your risk.
What are your thoughts? Is this the bottom or are we going lower? Drop your charts in the comments! 👇
#CryptoSelloffTriggersMultipleWhaleLiquidations #USSpotXRPETFsSeeLargestWeeklyOutflowIn8Months #BTC $EVAA $SOPH
$BTC is currently experiencing a severe bearish momentum, as seen on the daily chart. After a strong rejection from the $86,000 region, the price has aggressively printed multiple large red candles, erasing weeks of gains and dropping sharply to the $64,000 level.
Key Levels to Watch:
📉 Immediate Support (Demand Zone): $60,000 - $64,000
If we look to the left, this current price zone acted as a massive accumulation and support base in June and July. The price is currently testing the upper boundary of this historical demand zone.
📈 Immediate Resistance: $70,000 - $72,000
Any relief rally will first face heavy resistance here. The price would need to reclaim this area to invalidate the current short-term bearish structure.
🔴 Bearish Case:
The momentum is clearly downward. If the daily candle closes firmly below $62,000, the next logical liquidity grab could be down toward the $58,000 - $56,000 range.
🟢 Bullish Case (Relief Rally):
A bounce from this historical support zone is highly probable. If we see a bullish reversal candle (like a hammer or a strong engulfing) forming around $64,000, we could see a short-term relief rally back up to retest $68,000 - $70,000.
💡 Professional Advice:
Right now, patience is key. Do not try to catch a falling knife. Wait for price action confirmation such as a daily close above the previous support or a clear rejection wick before opening a position. Always use strict stop-losses and manage your risk.
What are your thoughts? Is this the bottom or are we going lower? Drop your charts in the comments! 👇
#CryptoSelloffTriggersMultipleWhaleLiquidations #USSpotXRPETFsSeeLargestWeeklyOutflowIn8Months #BTC $EVAA $SOPH