🔥 $HYPE Technical Update: Key Levels & Momentum Breakdown
📊 1. Market Snapshot
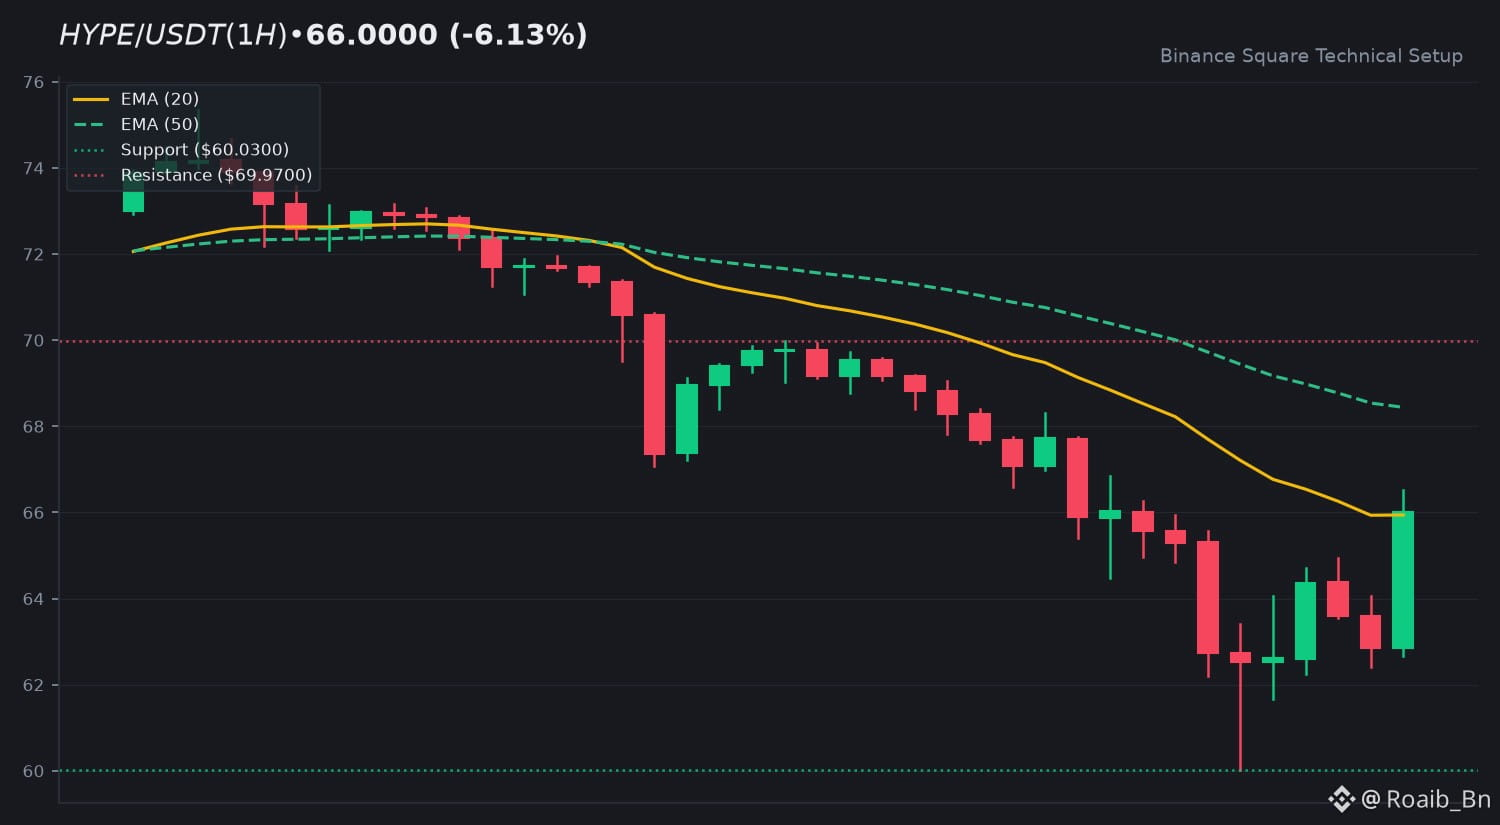
The asset $HYPE is currently trading at 66.0000 USDT, reflecting a 24h change of -6.13%. Market activity remains steady with a 24h quote volume of 105,374,921 USDT. The price action is currently oscillating within the range established by the daily high of 70.7200 and the low of 60.0300.
📈 2. Technical Momentum & Indicator Bias
$HYPE is currently navigating a complex technical landscape. The price sits at 66.0000, marginally above the EMA 20 of 65.9403, indicating a fragile short-term recovery attempt. However, the price remains below the EMA 50 of 68.4400, suggesting the medium-term trend still faces overhead pressure. The RSI at 46.85 reflects neutral momentum, neither overbought nor oversold. The MACD histogram is positive at +0.0211, though the lines remain in a bearish zone.
🎯 3. Key Technical Levels to Watch
• 🟢 Resistance Zone: 69.9700 is the immediate hurdle, followed by 73.2683.
• 🔴 Support Zone: 60.0300 serves as the primary floor.
• 🛡️ Pivot Confluence: 65.9403 (EMA 20) acts as the immediate pivot.
💡 4. Technical Takeaway & Risk Management
Traders are monitoring the interaction between the current price and the EMA 20. A sustained close above this level could signify a shift in momentum, while failure to hold this pivot may lead to retesting lower support. Risk management remains essential during periods of neutral RSI.
💬 5. Community Discussion
What is your technical outlook for $HYPE this week? Are you accumulating or waiting for confirmation? Drop your thoughts below! 👇
⚠️ 6. Disclaimer
Educational technical analysis only. Not financial advice (NFA). Crypto markets involve risk. Always DYOR.
$HYPE #HYPE #BinanceSquare
📊 1. Market Snapshot
The asset $HYPE is currently trading at 66.0000 USDT, reflecting a 24h change of -6.13%. Market activity remains steady with a 24h quote volume of 105,374,921 USDT. The price action is currently oscillating within the range established by the daily high of 70.7200 and the low of 60.0300.
📈 2. Technical Momentum & Indicator Bias
$HYPE is currently navigating a complex technical landscape. The price sits at 66.0000, marginally above the EMA 20 of 65.9403, indicating a fragile short-term recovery attempt. However, the price remains below the EMA 50 of 68.4400, suggesting the medium-term trend still faces overhead pressure. The RSI at 46.85 reflects neutral momentum, neither overbought nor oversold. The MACD histogram is positive at +0.0211, though the lines remain in a bearish zone.
🎯 3. Key Technical Levels to Watch
• 🟢 Resistance Zone: 69.9700 is the immediate hurdle, followed by 73.2683.
• 🔴 Support Zone: 60.0300 serves as the primary floor.
• 🛡️ Pivot Confluence: 65.9403 (EMA 20) acts as the immediate pivot.
💡 4. Technical Takeaway & Risk Management
Traders are monitoring the interaction between the current price and the EMA 20. A sustained close above this level could signify a shift in momentum, while failure to hold this pivot may lead to retesting lower support. Risk management remains essential during periods of neutral RSI.
💬 5. Community Discussion
What is your technical outlook for $HYPE this week? Are you accumulating or waiting for confirmation? Drop your thoughts below! 👇
⚠️ 6. Disclaimer
Educational technical analysis only. Not financial advice (NFA). Crypto markets involve risk. Always DYOR.
$HYPE #HYPE #BinanceSquare