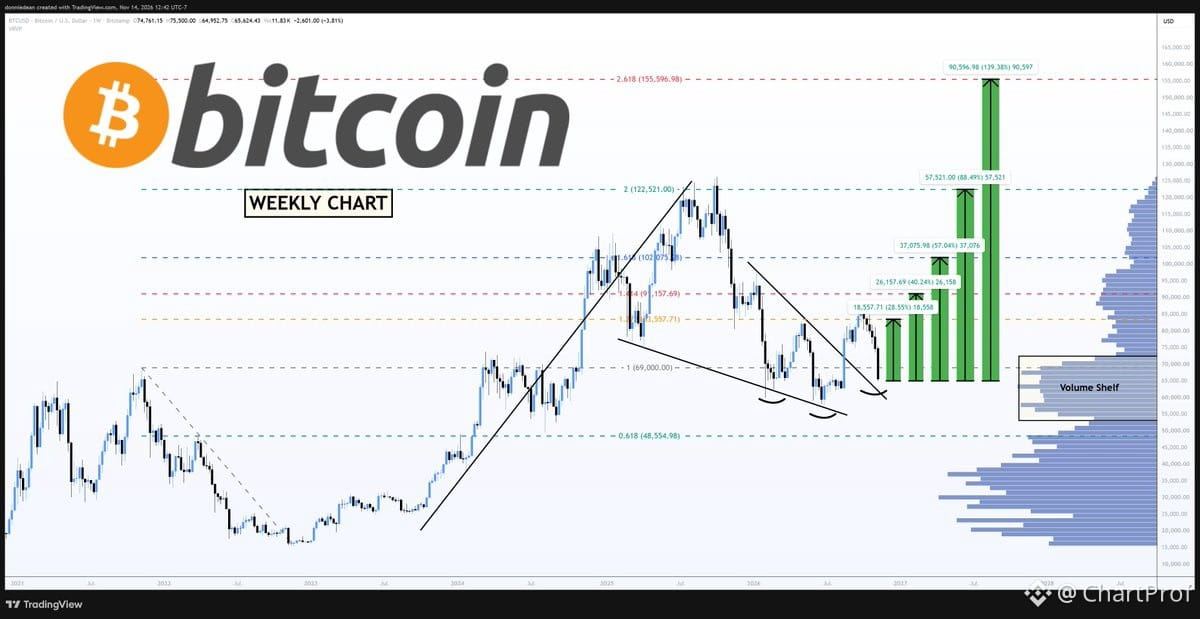
Let's walk through what the chart is showing us right now on $BTC — and why the structure still favors upside.
First, the inverse head and shoulders pattern remains intact. That's your baseline bullish structure. We're now retesting the wedge breakout, which is exactly what you want to see — price respecting prior resistance as new support. Both of these are textbook confirmations that the bottom is likely in.
Historically, bottoms tend to form around 12 months after a peak. We're now at 13 months. That timing lines up.
From the current base around $65,000, here's the roadmap:
$83,557 → +28%
$91,157 → +40%
$102,075 → +57% (Golden Ratio extension)
$122,521 → +88% (retest of prior highs)
$155,596 → +139% (next Golden Ratio target)
These aren't random numbers — they're derived from Fibonacci extensions and prior structural highs. The Golden Ratio levels matter because they're where momentum tends to pause or accelerate.
What invalidates this? A clean break below the wedge support and loss of the inverse H&S neckline. Until then, the structure is bullish, the retest is holding, and the next leg is setting up.
This is how you read a chart: structure first, confirmation second, targets third. Right now, all three are aligned.
First, the inverse head and shoulders pattern remains intact. That's your baseline bullish structure. We're now retesting the wedge breakout, which is exactly what you want to see — price respecting prior resistance as new support. Both of these are textbook confirmations that the bottom is likely in.
Historically, bottoms tend to form around 12 months after a peak. We're now at 13 months. That timing lines up.
From the current base around $65,000, here's the roadmap:
$83,557 → +28%
$91,157 → +40%
$102,075 → +57% (Golden Ratio extension)
$122,521 → +88% (retest of prior highs)
$155,596 → +139% (next Golden Ratio target)
These aren't random numbers — they're derived from Fibonacci extensions and prior structural highs. The Golden Ratio levels matter because they're where momentum tends to pause or accelerate.
What invalidates this? A clean break below the wedge support and loss of the inverse H&S neckline. Until then, the structure is bullish, the retest is holding, and the next leg is setting up.
This is how you read a chart: structure first, confirmation second, targets third. Right now, all three are aligned.