🔥 $ZEC Technical Update: Key Levels & Momentum Breakdown
📊 1. Market Snapshot
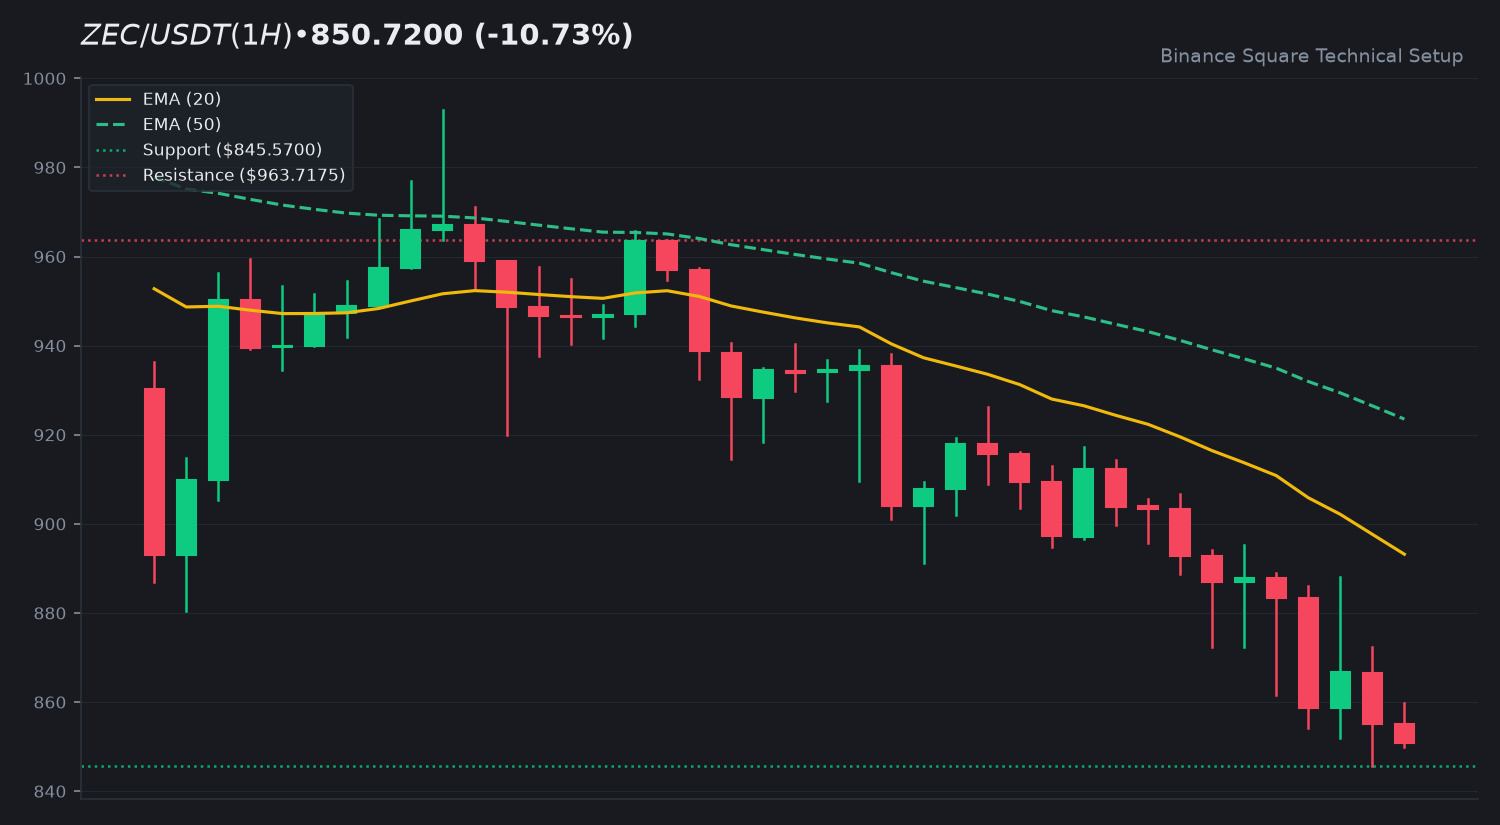
The current price of $ZEC is 850.7200 USDT, reflecting a 24h change of -10.73 percent. Trading activity shows a 24h quote volume of 162,069,168 USDT. Current volume remains low, sitting at approximately 0.3x the 20-SMA, suggesting a period of consolidation with relatively weak conviction.
📈 2. Technical Momentum & Indicator Bias
The price is currently trading below both the EMA 20 at 893.1829 and the EMA 50 at 923.5124, which confirms a prevailing bearish trend posture. The RSI is currently at 27.03, placing the asset in oversold territory. The MACD histogram shows a reading of -4.3010, with the MACD line positioned below the signal line, indicating continued downward momentum.
🎯 3. Key Technical Levels to Watch
• 🟢 Resistance Zone: Initial resistance is found at 963.7175, with secondary resistance marked at 1,007.7180.
• 🔴 Support Zone: Immediate support is located at the 24h low of 845.5700.
• 🛡️ Pivot Confluence: Monitoring the 893.1829 level is essential, as reclaiming the EMA 20 would be a primary indicator of a potential shift in momentum.
💡 4. Technical Takeaway & Risk Management
Price action remains confined within a bearish structure. Traders often monitor the interaction between the current price and the EMA 20/50 levels to assess potential trend exhaustion. Given the oversold RSI, market participants typically look for signs of consolidation or volume expansion before evaluating trend strength.
💬 5. Community Discussion
What is your technical outlook for $ZEC this week? Are you accumulating or waiting for confirmation? Drop your thoughts below! 👇
⚠️ 6. Disclaimer
Educational technical analysis only. Not financial advice (NFA). Crypto markets involve risk. Always DYOR.
$ZEC #ZEC #BinanceSquare
📊 1. Market Snapshot
The current price of $ZEC is 850.7200 USDT, reflecting a 24h change of -10.73 percent. Trading activity shows a 24h quote volume of 162,069,168 USDT. Current volume remains low, sitting at approximately 0.3x the 20-SMA, suggesting a period of consolidation with relatively weak conviction.
📈 2. Technical Momentum & Indicator Bias
The price is currently trading below both the EMA 20 at 893.1829 and the EMA 50 at 923.5124, which confirms a prevailing bearish trend posture. The RSI is currently at 27.03, placing the asset in oversold territory. The MACD histogram shows a reading of -4.3010, with the MACD line positioned below the signal line, indicating continued downward momentum.
🎯 3. Key Technical Levels to Watch
• 🟢 Resistance Zone: Initial resistance is found at 963.7175, with secondary resistance marked at 1,007.7180.
• 🔴 Support Zone: Immediate support is located at the 24h low of 845.5700.
• 🛡️ Pivot Confluence: Monitoring the 893.1829 level is essential, as reclaiming the EMA 20 would be a primary indicator of a potential shift in momentum.
💡 4. Technical Takeaway & Risk Management
Price action remains confined within a bearish structure. Traders often monitor the interaction between the current price and the EMA 20/50 levels to assess potential trend exhaustion. Given the oversold RSI, market participants typically look for signs of consolidation or volume expansion before evaluating trend strength.
💬 5. Community Discussion
What is your technical outlook for $ZEC this week? Are you accumulating or waiting for confirmation? Drop your thoughts below! 👇
⚠️ 6. Disclaimer
Educational technical analysis only. Not financial advice (NFA). Crypto markets involve risk. Always DYOR.
$ZEC #ZEC #BinanceSquare