
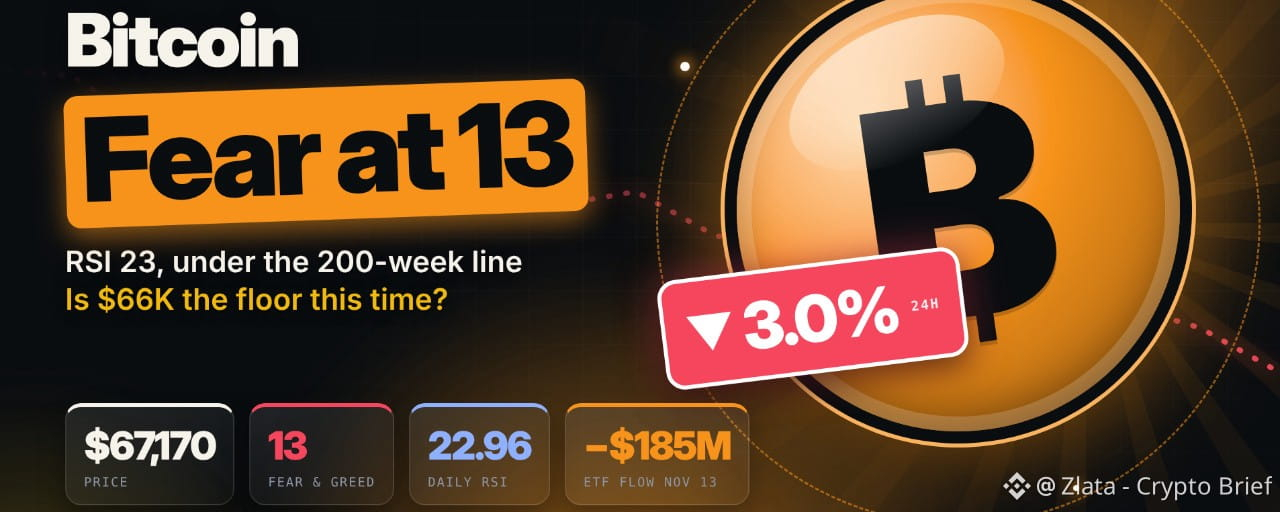


Thirteen is the Crypto Fear & Greed reading on Saturday morning, down from 29 on Wednesday, and it lands as $BTC trades near $67,170, about 3% lower on the day and close to 12% lower on the week. The session low came in at $66,456, the weakest print since August.
Three numbers explain most of this week. Each one also tells you what would have to change for the slide to stop.
NUMBER ONE: 6.5%
That's how fast US producer prices rose over the past year in October's PPI report, released Friday. It's the quickest pace since November 2022. The monthly print (+0.3%) was actually a touch under forecasts, but the yearly figure did the damage after a hot CPI earlier in the week.
Coinbase Institutional says rate expectations are the main driver now. Markets price roughly 64 basis points of Fed hikes over the next 12 months, up from 37 earlier in November. Fed Governor Waller has backed a December hike, and the dollar index touched 103.4, its highest since April 2025. A stronger dollar and higher rates rarely help a non-yielding asset.
NUMBER TWO: 7 straight days
Spot bitcoin ETFs saw net outflows of about $185M on Nov 13 (SoSoValue), the seventh red day in a row. BlackRock's IBIT shed roughly $144M and Fidelity's FBTC about $42M. Coinbase Institutional counts close to $3B leaving since Oct 30, with Nov 4 the only inflow day.
Stablecoins tell the same story. Supply fell about $11.5B in 30 days, the biggest decline Coinbase Institutional has recorded. Less dry powder on exchanges means thinner bids.
There's one more overhang. MSCI confirmed Strategy will leave its global indexes after Nov 30, which could force around $2.8B of MSTR share sales by index funds.
NUMBER THREE: 22.96
That's the daily RSI, per crypto.news. Deep oversold for $BTC . But oversold can stay oversold in a downtrend, and there's no bullish divergence on the daily chart yet.
The map right now: • $68,000: the 200-week average (~$67,992). Price slipped under it Friday night. Reclaiming it on a daily close is step one. • $70,000, then ~$73,000: the round number, then the 200-day average. • $66,000: the floor Coinbase Institutional flags. If $66K to $68K fails, their next level is $62,000. • $64,686: the Aug 19 daily close.
Derivatives cooled off. CoinGlass data showed $1.3B to $1.6B in liquidations on Friday, mostly longs, and funding has dropped to about +0.003%, near flat. Less leverage means fewer forced sellers left, which is how floors usually start.
🐋 WALLETS AND EXCHANGES
About 5,738 BTC left exchanges in the latest 24h on net, and exchange reserves dipped 0.22% to about 2.60M BTC.
Two 2010-era wallets moved 100 $BTC (~$6.9M) on Nov 13 to new addresses, flagged by Whale Alert. No exchange deposit had been seen.
Glassnode's Nov 11 report showed wallets holding 100 to 10,000 BTC as net buyers. If outflows from exchanges keep up while price holds $66K, that would point to absorption. One day of data isn't a trend, though.
THREE PATHS FROM HERE
🟢 A daily close back above $68K plus ETF flows turning positive opens $70K, then $73K.
⚪ Chop between $66K and $68.5K into Sunday's weekly close (Nov 15).
🔴 A daily close under $66K brings $64.7K and then $62K into play.
What analysts are saying
Coinbase Institutional: a move back above $73K would improve odds of a return to $80K.
Bitget Wallet analysts tied any lasting recovery to positive ETF flows and stronger spot demand.
Dates
Nov 15, 00:00: weekly candle close
Nov 30: MSCI removal of Strategy takes effect
December: next Fed decision, hike odds rising
My read
The selling is mostly about rates and the dollar, which is why it's sticky. I'd want a daily close above $68K before calling this a floor. Extreme fear plus falling leverage is where bounces start, but they need a trigger.
Your turn 👇 Fear & Greed is at 13 today. What number does it show on Monday? Drop your guess.
A) Above $70K
B) $66K to $70K
C) Below $66K
#BTC #BTC走势分析 #CryptoNews #Write2Earn #FedRateHike
Educational content, not financial advice. DYOR.