#bitcoinbreaksbelow200weekmovingaverage
Bitcoin has broken below its 200-week simple moving average (200WMA).
Historically, the 200WMA has served as the ultimate structural baseline support across major multi-year cycles. When price action drops below this boundary, it reshapes both macro sentiment and tactical trading strategies.
Current Market Breakdown Context
Key Support Breach: Bitcoin traded as low as $67,500 – $67,652, penetrating the critical 200WMA boundary near $68,000.
Macro Pressure: The breakdown coincides with macroeconomic tightening—driven by elevated U.S. 10-year Treasury yields reaching 5.125%, the DXY breaking above 103, and persistent spot Bitcoin ETF outflows totaling $1.44B to $2.57B over recent weeks.
Leverage Wipeout: Over $1.3B in total futures liquidations hit the market across 24 hours, with more than $677M in Bitcoin positions liquidated.
What History Teaches About 200WMA Breaches
Historically, a 200WMA breakdown marks a transition into deep structural value zones or prolonged macro accumulation periods:
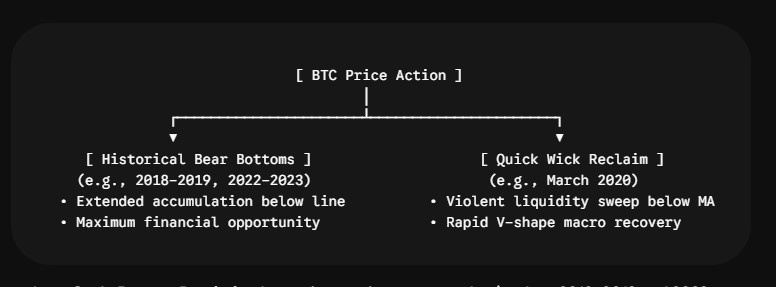
Cycle Bottom Proximity: In previous major crypto cycles (such as 2018–2019 and 2022–2023), trading below the 200WMA signaled the terminal structural phase of a bear trend.
The Liquidity Sweep Risk: Historically, wicks below the 200-week line act as high-volume liquidity clearouts designed to trigger mass stop-losses before structural bottoms form.
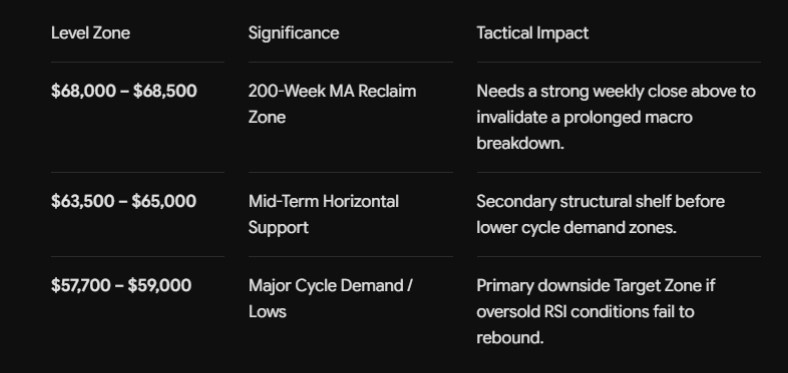
Indicator Confluence: When the weekly Relative Strength Index (RSI) drops alongside a 200WMA breach, failure to hold immediate horizontal floors (e.g., around $57,700) leaves open potential retests of prior cycle demand blocks.
Key Technical Levels to Track