$FET: Why Admitting When Data Is Unavailable Is a Sign of Analytical Integrity
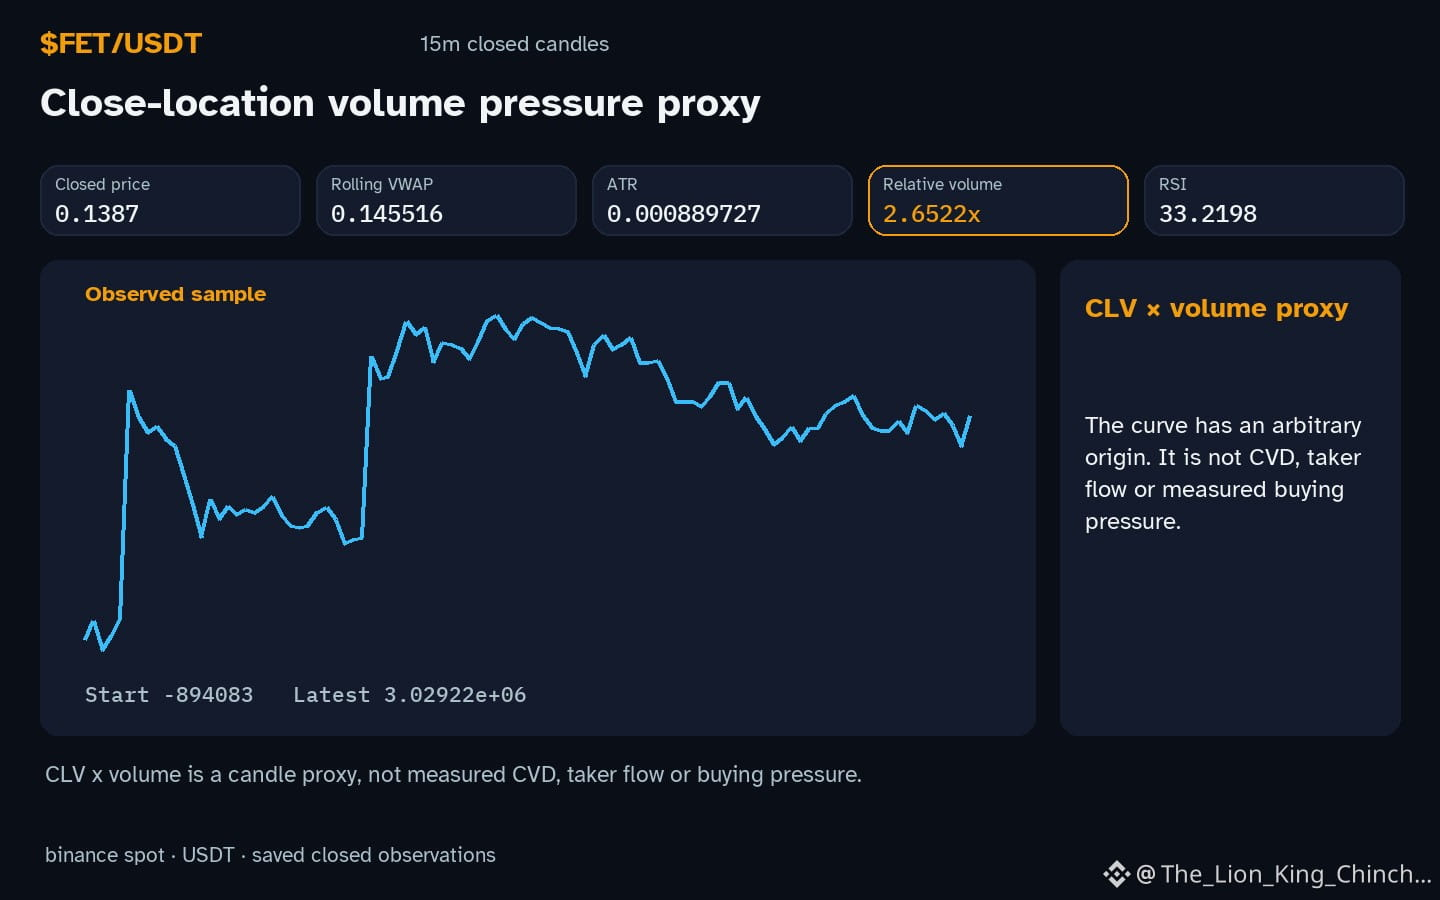
The token $FET is currently trading inside its recorded range while hourly direction points down and volume sits above baseline. How should analysts treat a setup when key feeds such as open interest or funding rates are missing?
One observation shows a modest hourly decline of -0.857756% and a relative volume of 2.65x baseline. Some readers might infer that the lack of on‑chain or funding data weakens confidence in any directional claim. A counter‑scenario suggests that the same price action could be interpreted as a neutral pause, because the RSI 33.2 remains in a mid‑range zone and no clear breakout pattern emerges.
The mechanism to test these competing views is simple: note the missing feed, then deliberately refrain from assigning certainty to any outcome. Instead, record the observable metrics – price change, relative volume, and RSI – and wait for the next closed candle. If the subsequent hourly candle closes with a larger move beyond the current support or resistance levels, the earlier uncertainty may be resolved. Conversely, if price remains within the range and volume returns to baseline, the initial hesitation gains support.
A practical self‑check is to write down the current observation, label the unavailable data, and set a reminder to revisit the chart after the next hourly close. This disciplined pause helps separate what is known from what is assumed, encouraging honest analysis without over‑promising outcomes.
Probabilistic market research, not a recommendation or guaranteed return.
#FET #CryptoCommunity
The token $FET is currently trading inside its recorded range while hourly direction points down and volume sits above baseline. How should analysts treat a setup when key feeds such as open interest or funding rates are missing?
One observation shows a modest hourly decline of -0.857756% and a relative volume of 2.65x baseline. Some readers might infer that the lack of on‑chain or funding data weakens confidence in any directional claim. A counter‑scenario suggests that the same price action could be interpreted as a neutral pause, because the RSI 33.2 remains in a mid‑range zone and no clear breakout pattern emerges.
The mechanism to test these competing views is simple: note the missing feed, then deliberately refrain from assigning certainty to any outcome. Instead, record the observable metrics – price change, relative volume, and RSI – and wait for the next closed candle. If the subsequent hourly candle closes with a larger move beyond the current support or resistance levels, the earlier uncertainty may be resolved. Conversely, if price remains within the range and volume returns to baseline, the initial hesitation gains support.
A practical self‑check is to write down the current observation, label the unavailable data, and set a reminder to revisit the chart after the next hourly close. This disciplined pause helps separate what is known from what is assumed, encouraging honest analysis without over‑promising outcomes.
Probabilistic market research, not a recommendation or guaranteed return.
#FET #CryptoCommunity