⚡ Market Titans Dual Analysis: Bitcoin $BTC vs Ethereum $ETH
1. Bitcoin $BTC Technical Outlook
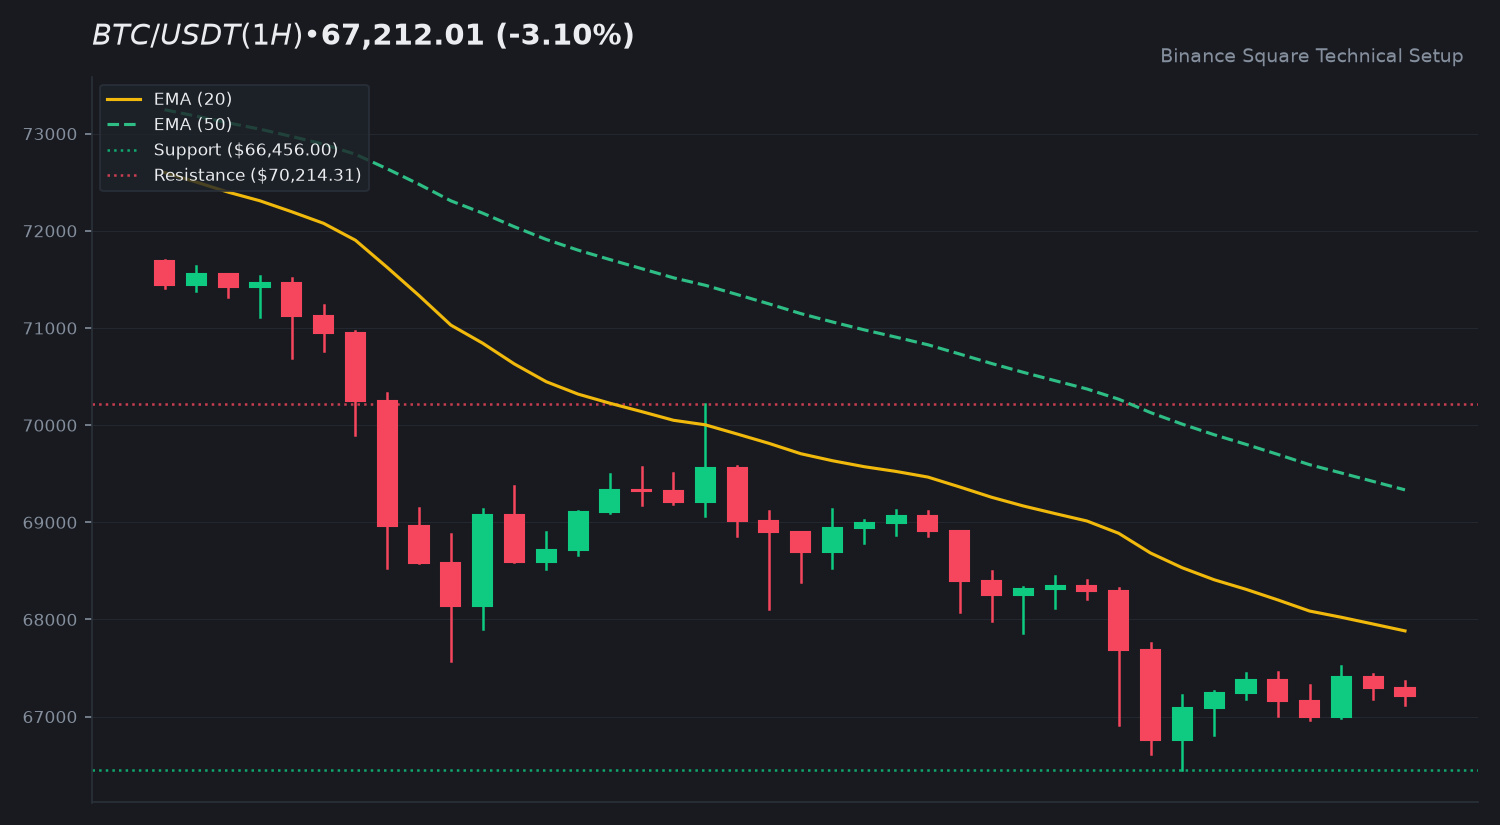
The lead asset is currently navigating a strong downtrend, trading at 67,212.01. Price action remains positioned below both the EMA 20 (67,882.73) and EMA 50 (69,334.34), signaling sustained selling pressure. With an RSI of 34.34, the asset is approaching oversold territory but has not yet signaled a reversal. Key technical levels to monitor include the immediate support floor at 66,456.00 and resistance zones established at 70,214.31 and 74,450.88.
2. Ethereum $ETH Technical Outlook
Ethereum $ETH is showing slightly more resilience compared to the broader market, priced at $1,908.81. While it trades below the EMA 20 ($1,919.48) and EMA 50 ($1,953.81), the RSI at 41.57 suggests a more stable momentum profile than its counterpart. The immediate support floor sits at $1,900.35, while upside recovery will need to contend with resistance levels at $1,956.50 and $1,989.11.
3. Macro Confluence & Market Structure
The current market environment reflects a cautious sentiment across the board. Bitcoin $BTC continues to dictate the broader trend, while Ethereum $ETH maintains a tighter consolidation range. Both assets are currently testing critical support levels, and traders are observing volume flows to confirm if current floors will hold or if further consolidation is required before a shift in market structure occurs.
4. Community Discussion
Which asset do you expect to lead momentum this week: $BTC or $ETH? Share below! 👇
⚠️ Educational analysis only. Not financial advice (NFA). DYOR.
$BTC $ETH #BinanceSquare #CryptoMarket
1. Bitcoin $BTC Technical Outlook
The lead asset is currently navigating a strong downtrend, trading at 67,212.01. Price action remains positioned below both the EMA 20 (67,882.73) and EMA 50 (69,334.34), signaling sustained selling pressure. With an RSI of 34.34, the asset is approaching oversold territory but has not yet signaled a reversal. Key technical levels to monitor include the immediate support floor at 66,456.00 and resistance zones established at 70,214.31 and 74,450.88.
2. Ethereum $ETH Technical Outlook
Ethereum $ETH is showing slightly more resilience compared to the broader market, priced at $1,908.81. While it trades below the EMA 20 ($1,919.48) and EMA 50 ($1,953.81), the RSI at 41.57 suggests a more stable momentum profile than its counterpart. The immediate support floor sits at $1,900.35, while upside recovery will need to contend with resistance levels at $1,956.50 and $1,989.11.
3. Macro Confluence & Market Structure
The current market environment reflects a cautious sentiment across the board. Bitcoin $BTC continues to dictate the broader trend, while Ethereum $ETH maintains a tighter consolidation range. Both assets are currently testing critical support levels, and traders are observing volume flows to confirm if current floors will hold or if further consolidation is required before a shift in market structure occurs.
4. Community Discussion
Which asset do you expect to lead momentum this week: $BTC or $ETH? Share below! 👇
⚠️ Educational analysis only. Not financial advice (NFA). DYOR.
$BTC $ETH #BinanceSquare #CryptoMarket