#ERA
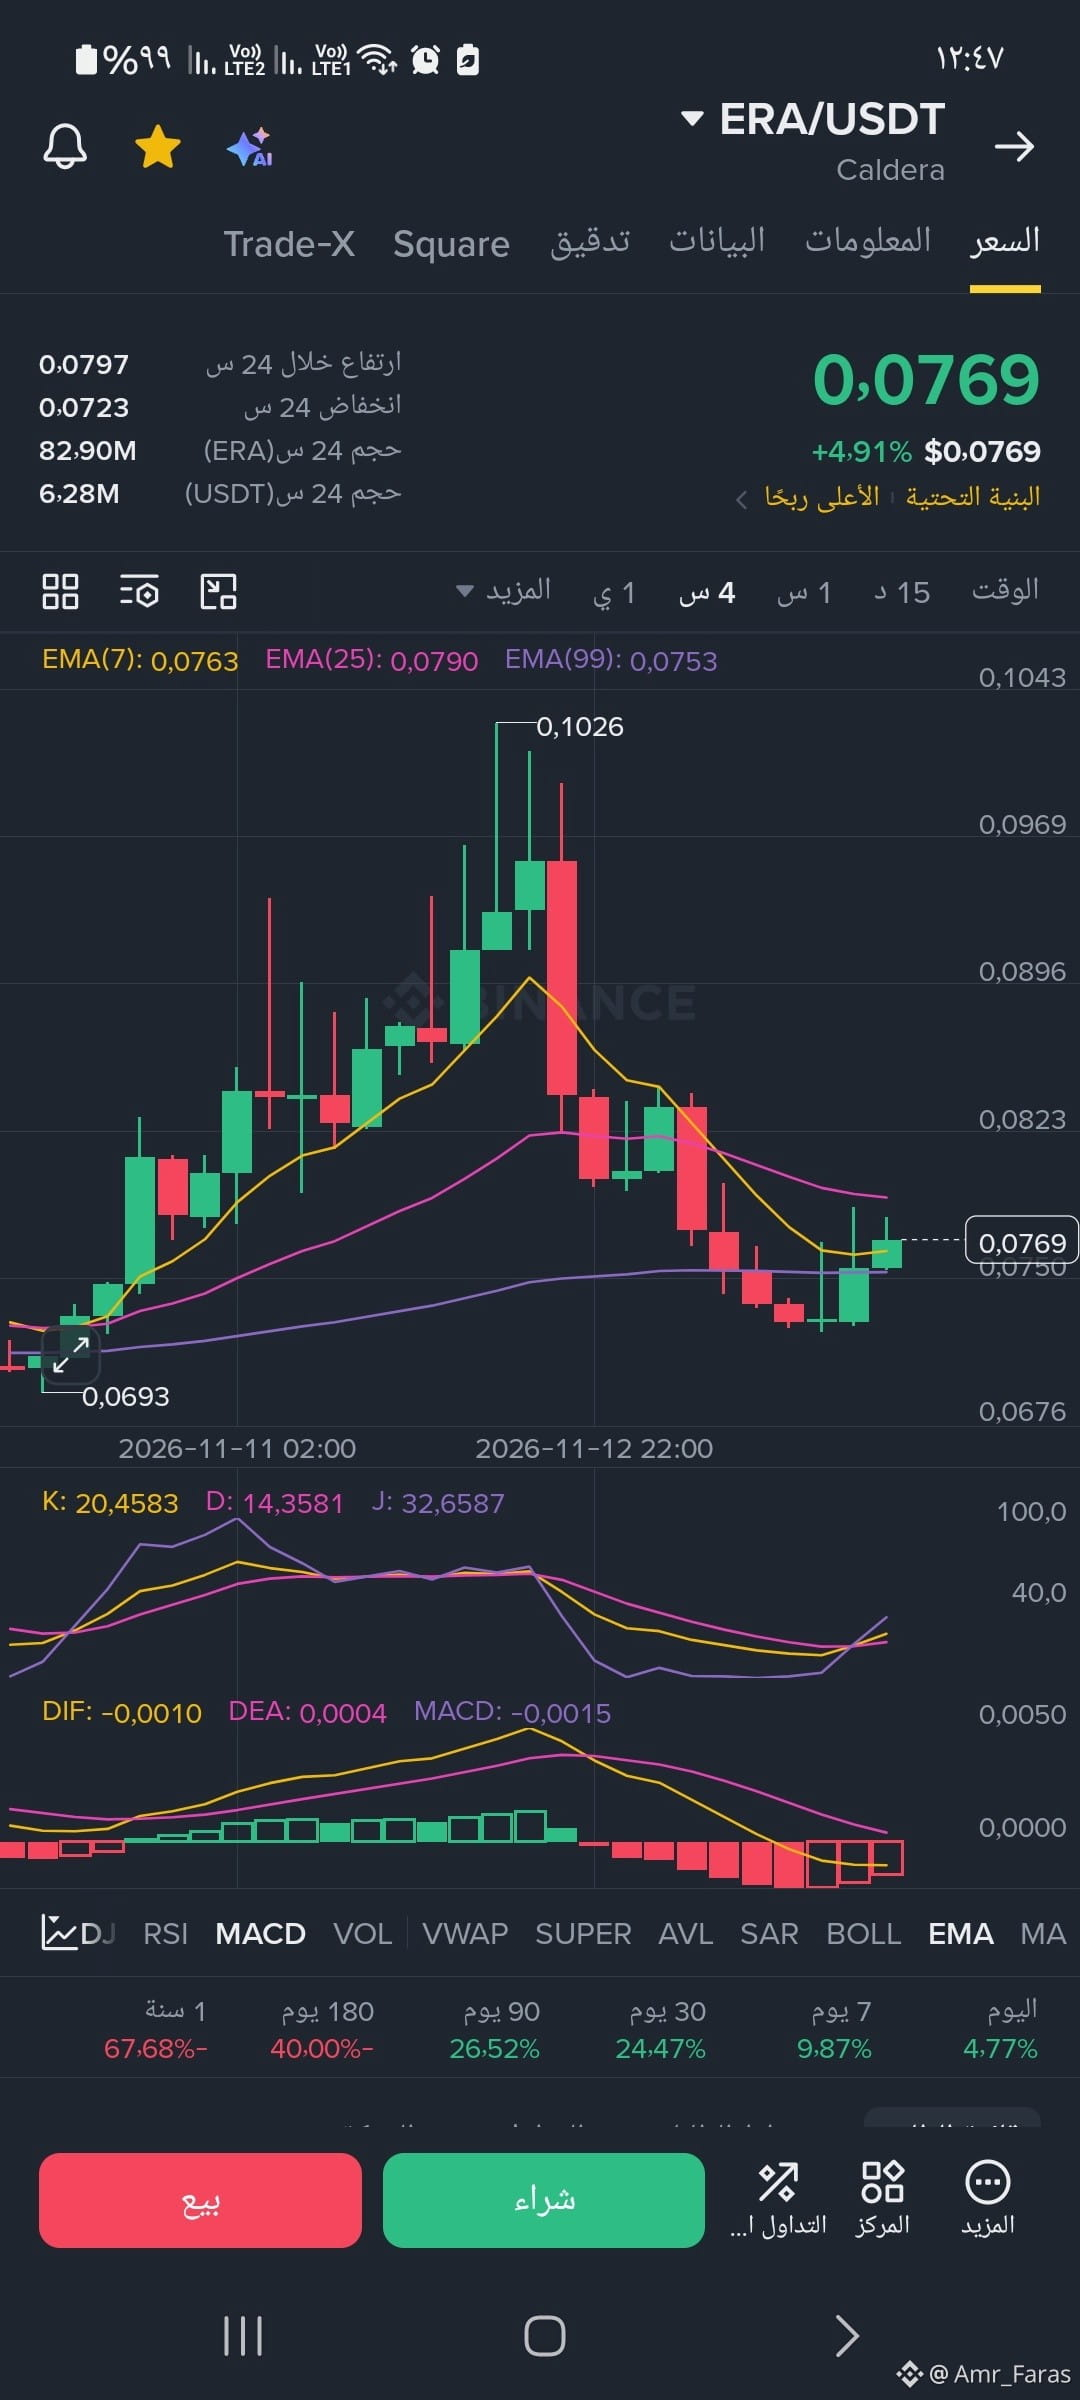
Interpreting the Apparent Technical Indicators
• Moving Averages (EMAs)
• The current price (0.0769) is trading above the fast EMA (7) at 0.0763 and above the long-term EMA (99) at 0.0753, which is a positive support signal.
• The price is facing near-term resistance at the EMA (25) at 0.0790.
• The KDJ indicator shows a bullish crossover in the oversold zone (K: 20.45 above D: 14.35), which supports the possibility of a continued upward rebound in the near term.
• The MACD indicator is still in the negative zone (-0.0015), but the red bars are gradually shrinking towards zero, reflecting a decrease in selling momentum.
Interpreting the Apparent Technical Indicators
• Moving Averages (EMAs)
• The current price (0.0769) is trading above the fast EMA (7) at 0.0763 and above the long-term EMA (99) at 0.0753, which is a positive support signal.
• The price is facing near-term resistance at the EMA (25) at 0.0790.
• The KDJ indicator shows a bullish crossover in the oversold zone (K: 20.45 above D: 14.35), which supports the possibility of a continued upward rebound in the near term.
• The MACD indicator is still in the negative zone (-0.0015), but the red bars are gradually shrinking towards zero, reflecting a decrease in selling momentum.