
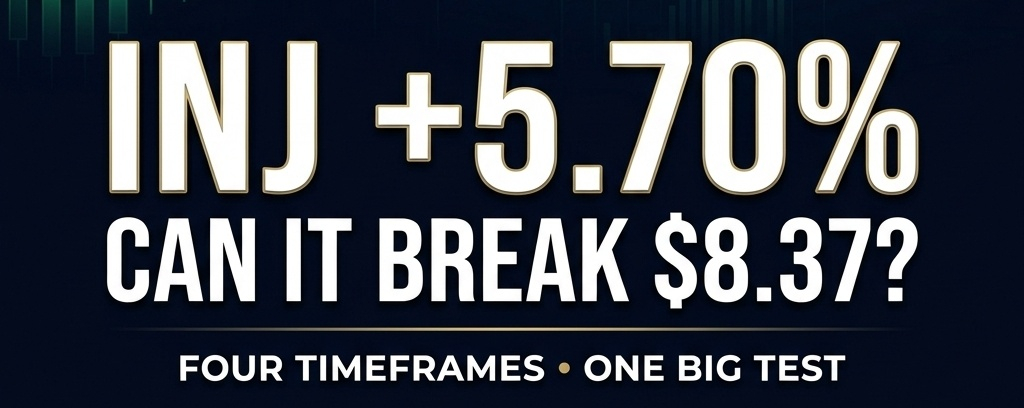

Injective (INJ) is showing positive momentum, trading around $8.004, up approximately 5.70% in the Binance chart screenshot.
But is this rally strong enough to continue?
The four-timeframe analysis reveals an interesting picture: the daily and 4-hour structures remain constructive, while the lower timeframes are showing signs of hesitation.
Let's break it down.
1. 15-Minute Chart: Momentum Needs Confirmation
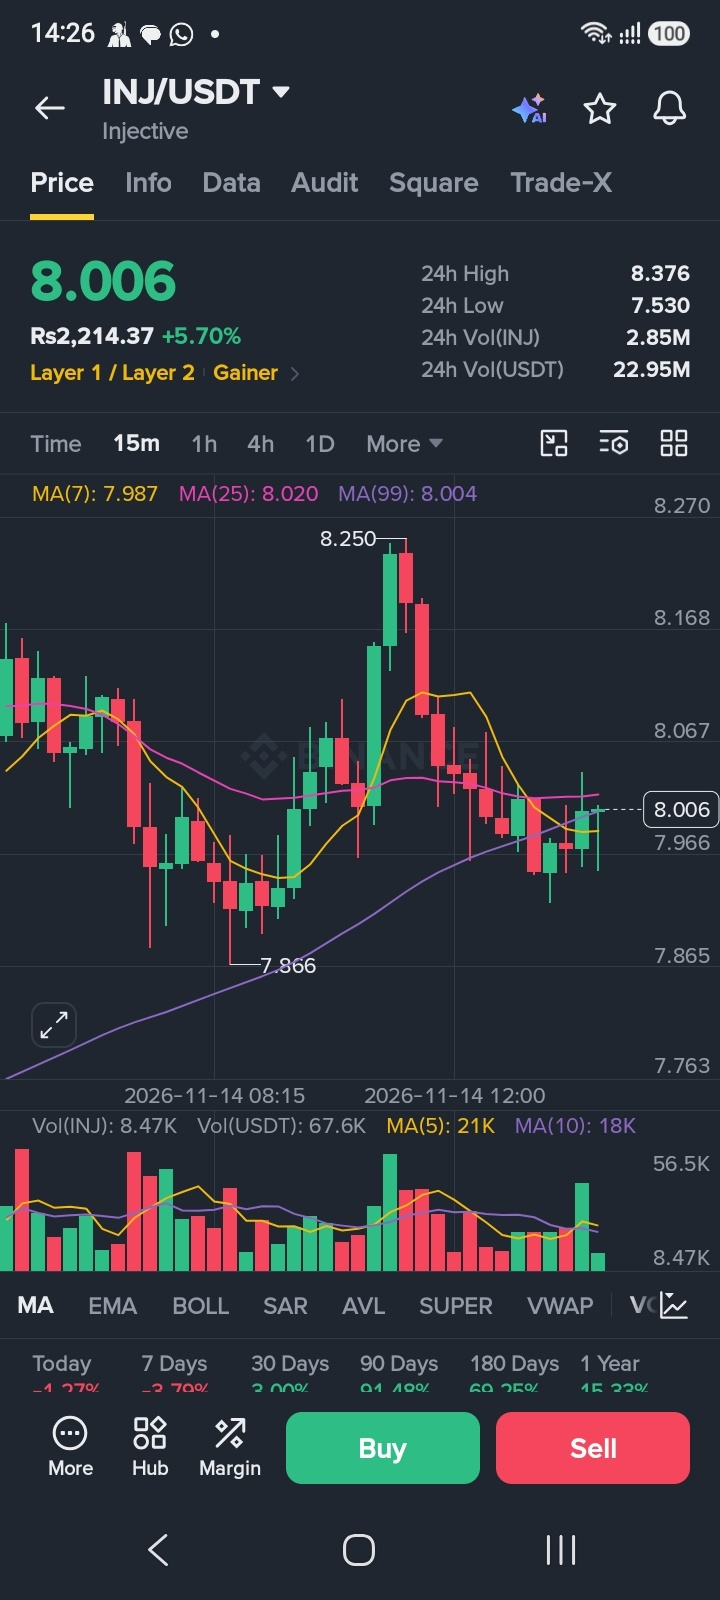
Moving Averages
MA(7): $7.987
MA(25): $8.020
MA(99): $8.004
INJ is slightly above MA(7), approximately at MA(99), but below MA(25).
This suggests that short-term momentum is not yet fully confirmed.
Volume
Candle volume: 8.47K INJ
MA(5): 21K
MA(10): 18K
Volume is below both averages, indicating weaker participation in the latest candle.
2. 1-Hour Chart: A Resistance Cluster
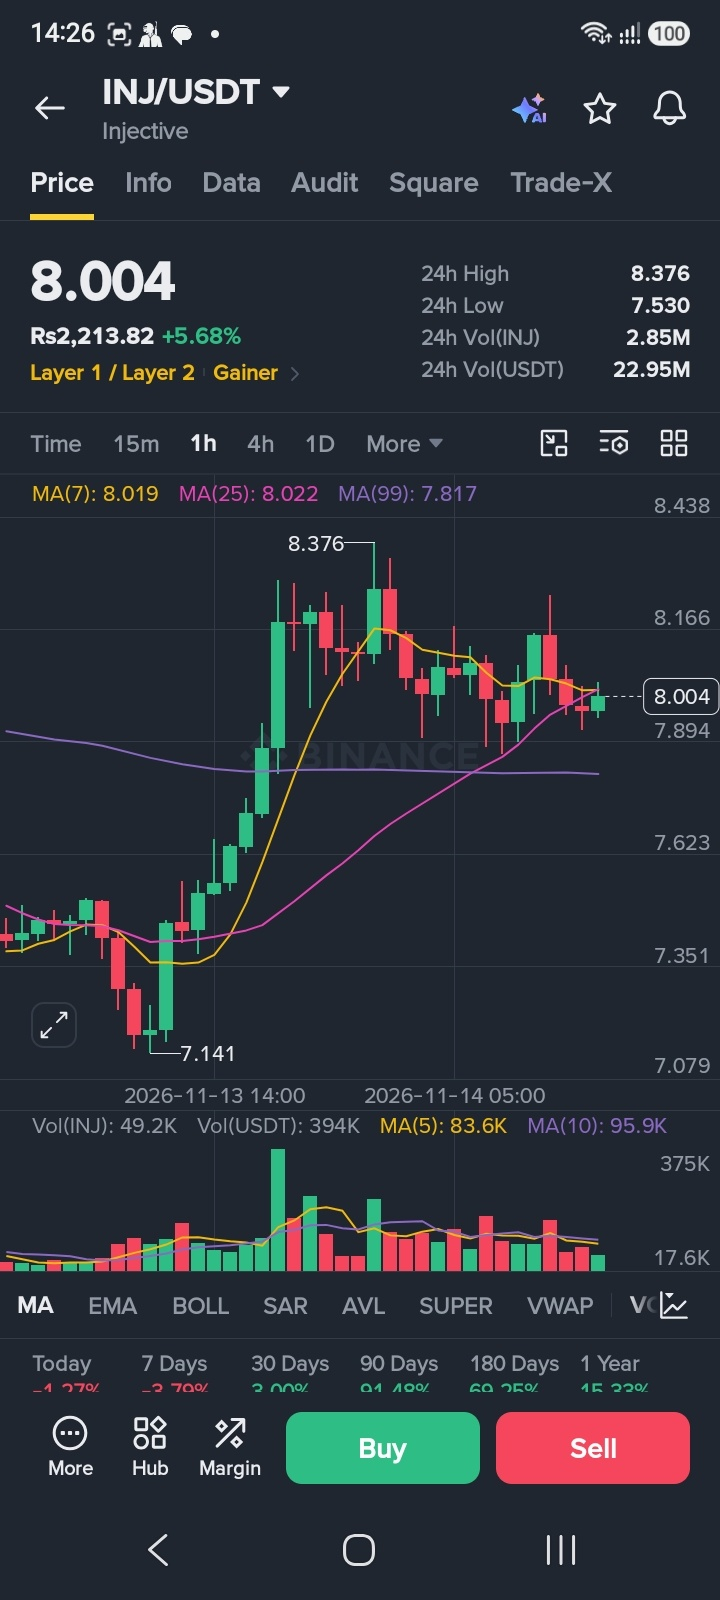
Moving Averages
MA(7): $8.019
MA(25): $8.022
MA(99): $7.817
Price is below MA(7) and MA(25), creating an immediate resistance zone around $8.019–$8.022.
However, it remains above MA(99), which is an important nearby support reference.
Volume
Candle volume: 49.2K INJ
MA(5): 83.6K
MA(10): 95.9K
Volume is below both averages. Buyers need stronger participation to overcome the hourly resistance.
3. 4-Hour Chart: The Broader Recovery Structure
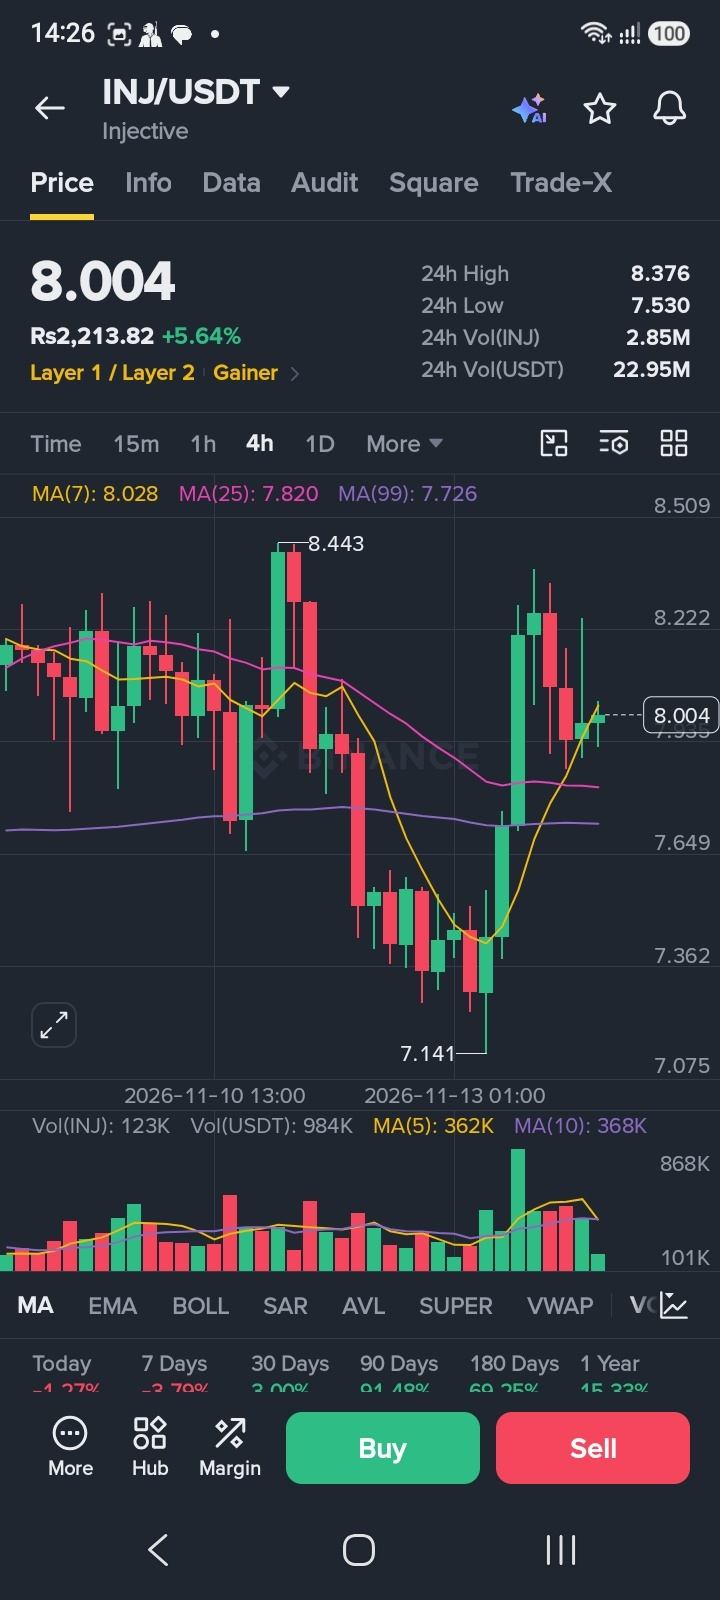
Moving Averages
MA(7): $8.028
MA(25): $7.820
MA(99): $7.726
INJ is slightly below MA(7), but remains above MA(25) and MA(99).
This is a constructive structure, although the $8.028 area needs to be reclaimed for stronger confirmation.
Volume
Candle volume: 123K INJ
MA(5): 362K
MA(10): 368K
Current volume is below both averages, suggesting that the latest move still lacks strong volume confirmation.
4. Daily Chart: The Strongest Part of the Setup
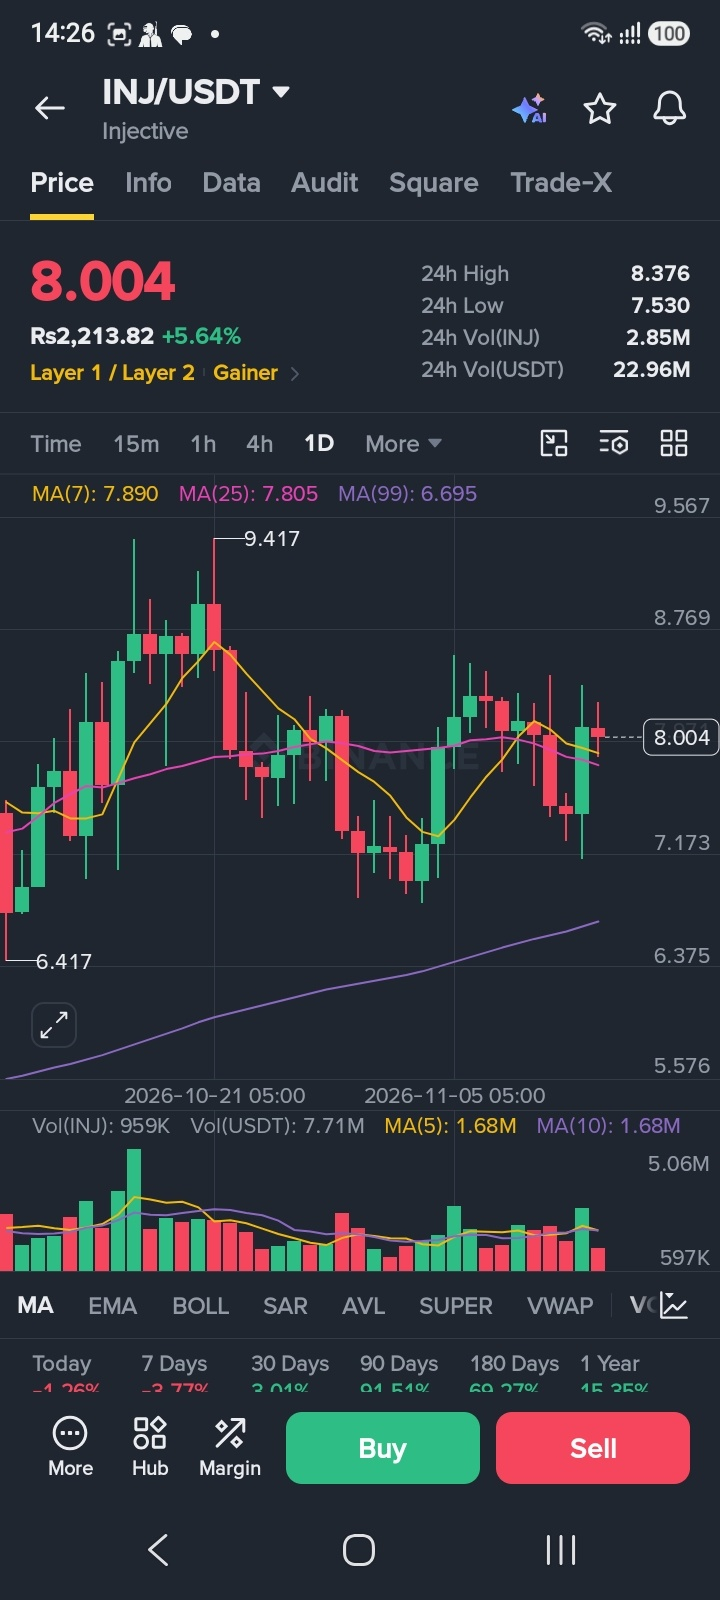
Moving Averages
MA(7): $7.890
MA(25): $7.805
MA(99): $6.695
The daily chart looks comparatively stronger.
INJ is trading above all three moving averages, suggesting that the broader recovery structure remains constructive.
Volume
Candle volume: 959K INJ
MA(5): 1.68M
MA(10): 1.68M
Daily volume is below both averages. The price structure looks positive, but stronger participation would improve confidence in the rally.
Key Support and Resistance Levels
Resistance
$8.019–$8.028 — Immediate moving-average resistance zone
$8.166–$8.250 — Higher chart resistance area
$8.376 — Recent 24-hour high
$8.438 — Additional chart resistance
Support
$7.987–$7.890 — Short-term support area
$7.820–$7.805 — Important 4H and daily moving-average zone
$7.726–$7.717 — Lower support reference
$7.530 — Recent 24-hour low
What Could Happen Next?
Bullish scenario: If INJ reclaims $8.02–$8.03 and holds above this zone with stronger volume, buyers could challenge $8.166–$8.250. A break above $8.376 would be another important development.
Bearish scenario: If price fails to hold the $7.987–$7.890 area, attention may shift toward $7.820–$7.805. A deeper correction could bring the $7.726 region into focus.
Consolidation scenario: INJ could remain range-bound while buyers and sellers compete around the $8.00 level.
Final Verdict
INJ has a mixed short-term structure but a more constructive 4H and daily picture.
The daily price remains above all three moving averages, while the 4H chart is above MA(25) and MA(99). However, lower-timeframe volume is relatively weak.
The next important test is the $8.02–$8.03 resistance zone. Can buyers reclaim it and challenge $8.376?
What is your prediction?
INJ breaks $8.376 and continues higher.
Resistance rejects the recovery.
INJ consolidates around $8.00 before its next move.
Share your analysis below!
Disclaimer: This article is for educational and informational purposes only, not financial advice. All readings are based on Binance chart screenshots supplied on November 14, 2026, and are not guaranteed live prices.
#BinancePick #INJ #Injective #CryptoAnalysis #Altcoins #CryptoMarket #TechnicalAnalysis