🔥 $ETH Technical Update: Key Levels & Momentum Breakdown
📊 1. Market Snapshot
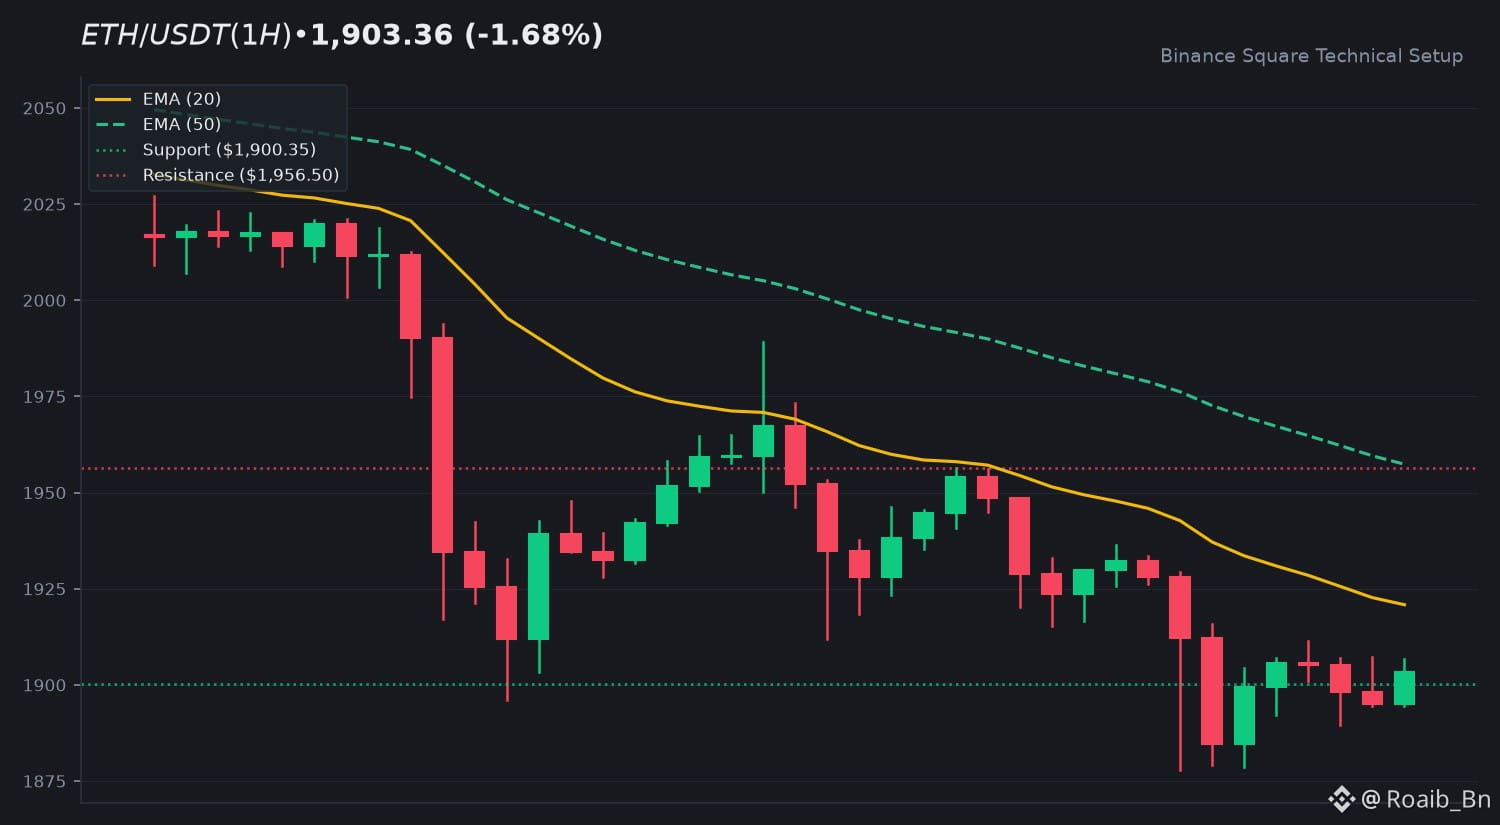
$ETH is currently trading at $1,903.36, reflecting a 24h change of -1.68%. The market is exhibiting low conviction today, with a 24h quote volume of 557.92M USDT. The volume ratio relative to the 20-SMA sits at 0.15x, indicating a period of consolidation with limited participation.
📈 2. Technical Momentum & Indicator Bias
$ETH remains in a defined downtrend, trading below both the EMA 20 ($1,920.85) and EMA 50 ($1,957.36). The RSI at 38.56 suggests the asset is approaching oversold territory but lacks significant bullish divergence. The MACD histogram is slightly positive at +0.0880, though the MACD line remains below the signal line, confirming the overall bearish posture.
🎯 3. Key Technical Levels to Watch
• 🟢 Resistance Zone: $1,956.50 serves as the immediate overhead hurdle, with secondary resistance at $1,989.11.
• 🔴 Support Zone: The floor is currently tested at $1,900.35. A failure to hold this level may shift focus to lower liquidity pockets.
• 🛡️ Pivot Confluence: The EMA 20 at $1,920.85 acts as the primary pivot for short-term sentiment shifts.
💡 4. Technical Takeaway & Risk Management
Price action is currently hovering near critical support. Traders often monitor whether the asset can reclaim the EMA 20 as a sign of weakening bearish momentum. Given the low volume, price sensitivity to news or large order flow may increase. Maintaining a focus on risk management and observing how the price interacts with the $1,900 support level is standard practice in this environment.
💬 5. Community Discussion
What is your technical outlook for $ETH this week? Are you accumulating or waiting for confirmation? Drop your thoughts below! 👇
⚠️ 6. Disclaimer
Educational technical analysis only. Not financial advice (NFA). Crypto markets involve risk. Always DYOR.
$ETH #ETH #BinanceSquare
📊 1. Market Snapshot
$ETH is currently trading at $1,903.36, reflecting a 24h change of -1.68%. The market is exhibiting low conviction today, with a 24h quote volume of 557.92M USDT. The volume ratio relative to the 20-SMA sits at 0.15x, indicating a period of consolidation with limited participation.
📈 2. Technical Momentum & Indicator Bias
$ETH remains in a defined downtrend, trading below both the EMA 20 ($1,920.85) and EMA 50 ($1,957.36). The RSI at 38.56 suggests the asset is approaching oversold territory but lacks significant bullish divergence. The MACD histogram is slightly positive at +0.0880, though the MACD line remains below the signal line, confirming the overall bearish posture.
🎯 3. Key Technical Levels to Watch
• 🟢 Resistance Zone: $1,956.50 serves as the immediate overhead hurdle, with secondary resistance at $1,989.11.
• 🔴 Support Zone: The floor is currently tested at $1,900.35. A failure to hold this level may shift focus to lower liquidity pockets.
• 🛡️ Pivot Confluence: The EMA 20 at $1,920.85 acts as the primary pivot for short-term sentiment shifts.
💡 4. Technical Takeaway & Risk Management
Price action is currently hovering near critical support. Traders often monitor whether the asset can reclaim the EMA 20 as a sign of weakening bearish momentum. Given the low volume, price sensitivity to news or large order flow may increase. Maintaining a focus on risk management and observing how the price interacts with the $1,900 support level is standard practice in this environment.
💬 5. Community Discussion
What is your technical outlook for $ETH this week? Are you accumulating or waiting for confirmation? Drop your thoughts below! 👇
⚠️ 6. Disclaimer
Educational technical analysis only. Not financial advice (NFA). Crypto markets involve risk. Always DYOR.
$ETH #ETH #BinanceSquare