$ONE : When Relative Volume Feels Misleading
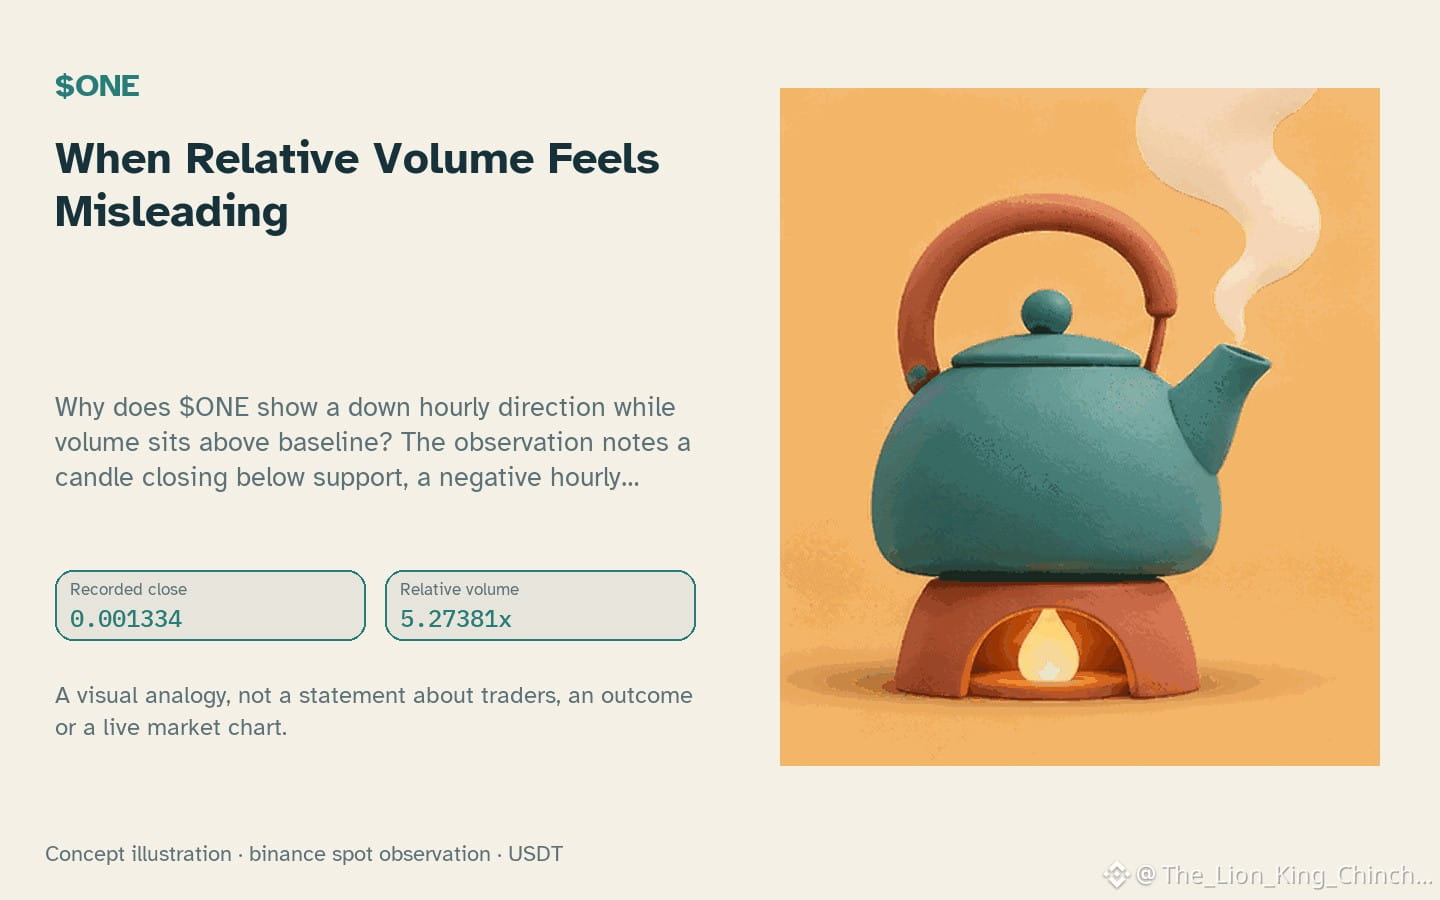
Why does $ONE show a down hourly direction while volume sits above baseline? The observation notes a candle closing below support, a negative hourly change, and a relative volume 5.27x baseline.\n\n**Myth:** High relative volume always confirms strong buying pressure and a likely breakout.\n\n**Reality:** Volume alone does not reveal who is active or why price moved. In this scenario the market sold enough to push the price under the recent support level, yet sellers generated enough trades to raise volume above the typical baseline. The mechanism is simple: a surge of sell orders can increase trade count, inflating volume metrics without indicating bullish intent.\n\n**Counterexample:** If a later candle closed above resistance with the same 5.27x baseline, the same volume reading would support a bullish interpretation. This shows that volume must be contextualized with price action and level breaks.\n\n**Self‑check:** Look for confirming signals such as RSI 32.4 or a change in the hourly price move -2.34261%. If RSI remains high and price rebounds, the earlier volume surge may have been a short‑term liquidation rather than a trend shift.\n\n**Reassessment condition:** Should the next closed candle stay above the prior support and the relative volume drop back toward baseline, the previous high‑volume reading would lose its bearish weight, prompting a revised view of market liquidity.
Probabilistic market research, not a recommendation or guaranteed return.
#ONE #CryptoLearning
Why does $ONE show a down hourly direction while volume sits above baseline? The observation notes a candle closing below support, a negative hourly change, and a relative volume 5.27x baseline.\n\n**Myth:** High relative volume always confirms strong buying pressure and a likely breakout.\n\n**Reality:** Volume alone does not reveal who is active or why price moved. In this scenario the market sold enough to push the price under the recent support level, yet sellers generated enough trades to raise volume above the typical baseline. The mechanism is simple: a surge of sell orders can increase trade count, inflating volume metrics without indicating bullish intent.\n\n**Counterexample:** If a later candle closed above resistance with the same 5.27x baseline, the same volume reading would support a bullish interpretation. This shows that volume must be contextualized with price action and level breaks.\n\n**Self‑check:** Look for confirming signals such as RSI 32.4 or a change in the hourly price move -2.34261%. If RSI remains high and price rebounds, the earlier volume surge may have been a short‑term liquidation rather than a trend shift.\n\n**Reassessment condition:** Should the next closed candle stay above the prior support and the relative volume drop back toward baseline, the previous high‑volume reading would lose its bearish weight, prompting a revised view of market liquidity.
Probabilistic market research, not a recommendation or guaranteed return.
#ONE #CryptoLearning