Every spike looked like a breakout. Every one was a trap. 🪤
A lot of traders were buying these pumps. Here's where the chart said SHORT instead 👇
Nov 13–14 | 4 coins | Same story
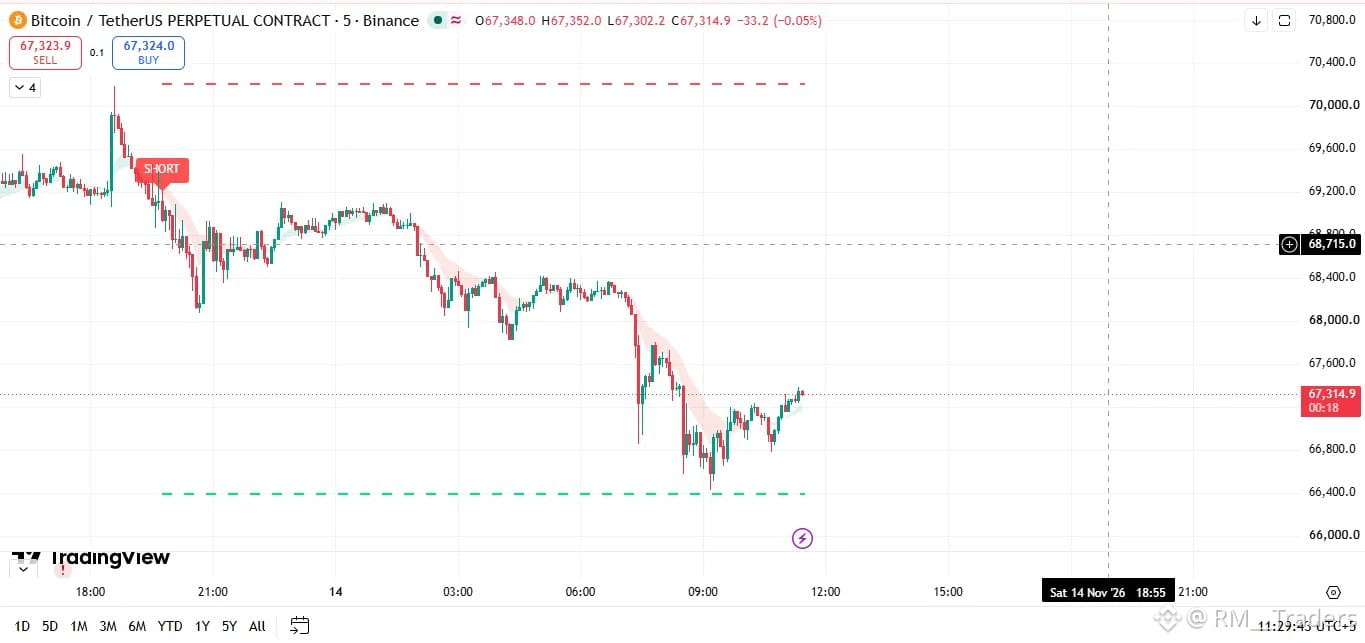
🟠 BTC/USDT
Spiked to ~$70,200, SHORT fired ~$69,300
Now ~$67,300 and still running = ~$2,000 per BTC 🔄
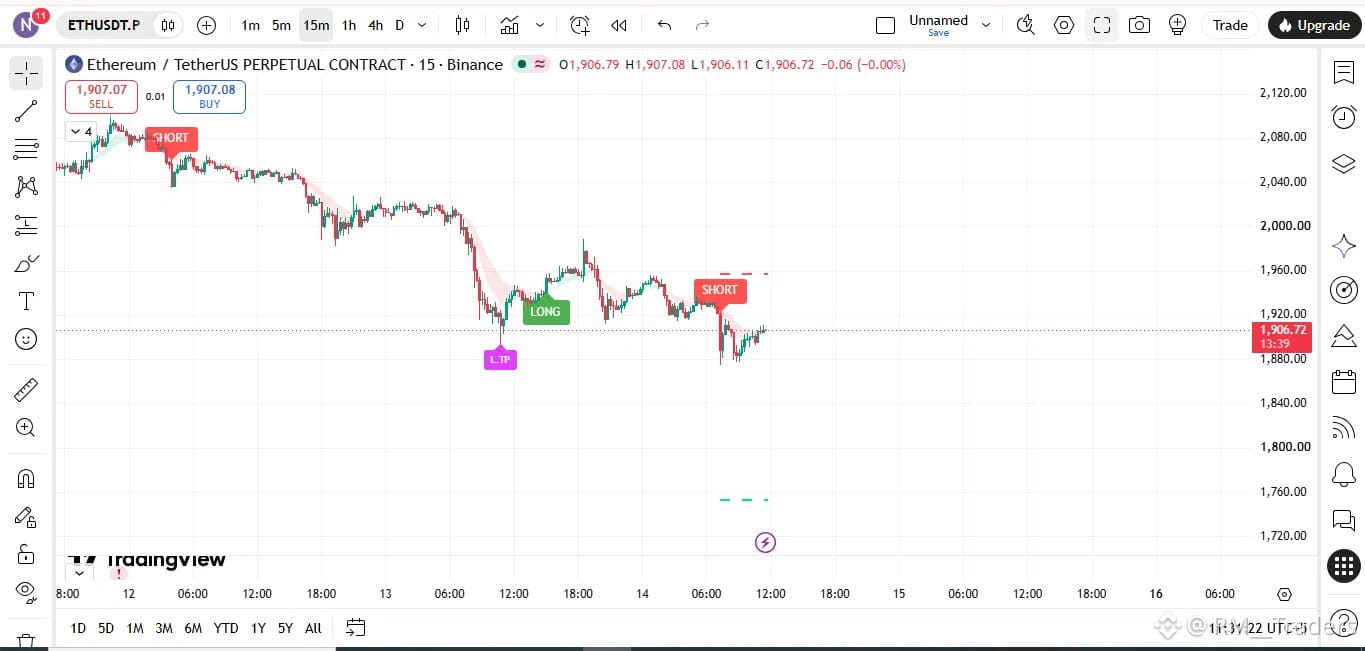
🔷 ETH/USDT
SHORT ~$2,075 → L.TP ~$1,900 = +$175 per ETH ✅
New SHORT running from ~$1,925 🔄
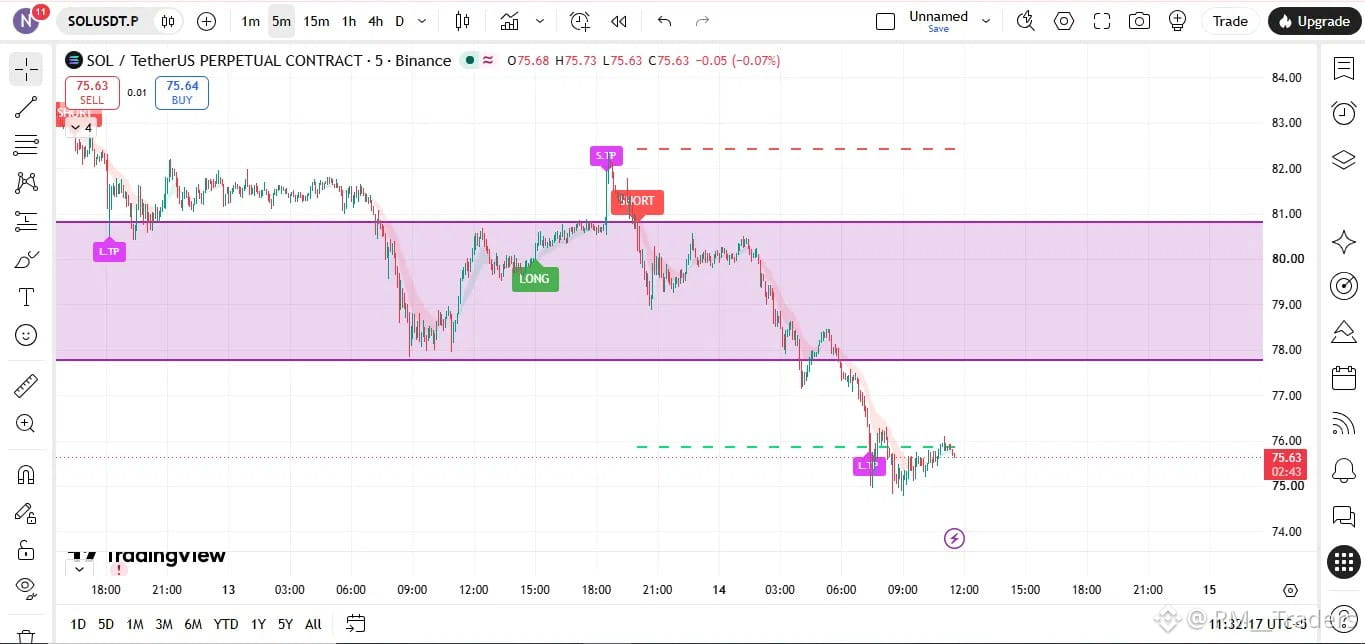
🟣 SOL/USDT
S.TP hit at the ~$82 spike, SHORT ~$81.00 → L.TP ~$75.40 = +$5.60 per SOL ✅
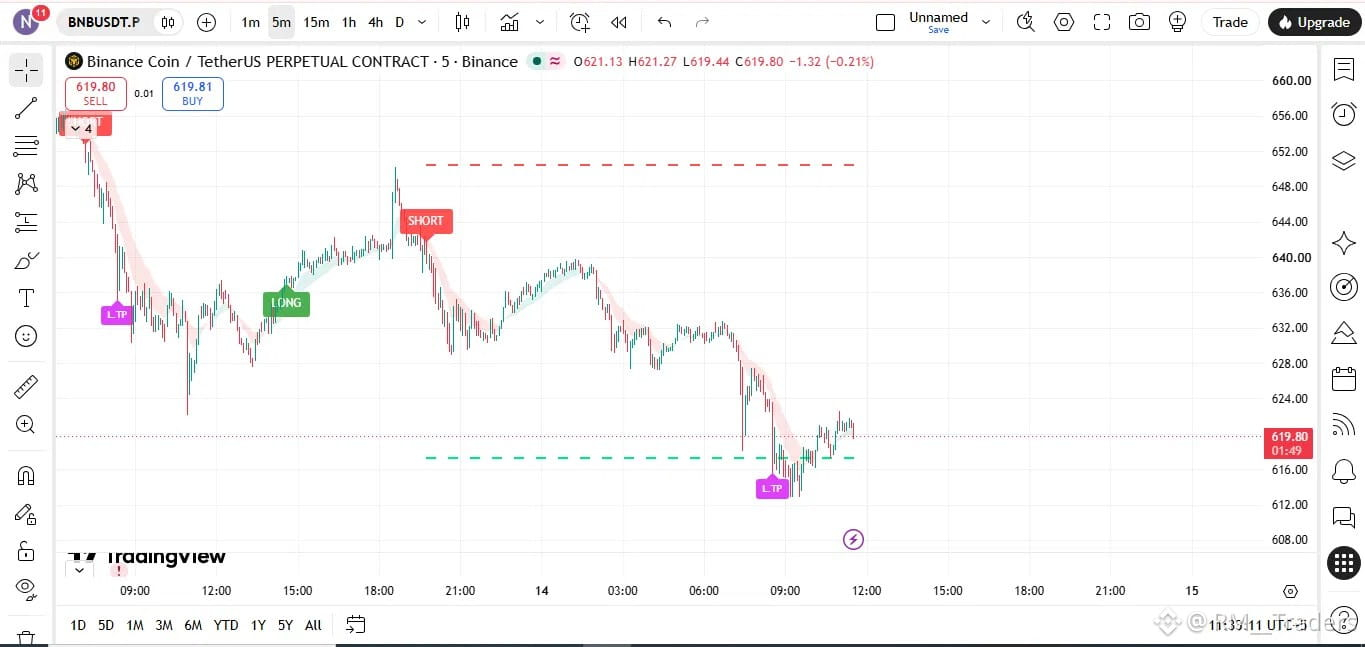
🟡 BNB/USDT
Spiked to ~$650, SHORT ~$643 → L.TP ~$614 = +$29 per BNB ✅
━━━━━━━━━━━━━━
Same pattern on all four:
Sharp spike up → crowd gets excited → price reverses
━━━━━━━━━━━━━━
When price rips higher fast, it feels like the start of a trend. Often it's the end of a move, and late buyers become the exit liquidity for everyone who bought lower.
The chart doesn't feel the excitement. It reads structure and waits for the signal. 🎯
(Not every spike reverses. That's why every trade has a stop loss.)
💬 COMMENT: Did you buy the spike or wait?
🟢 Bought the breakout
🔴 Shorted the spike
🟡 Waited on the sidelines
⚠️ Not financial advice. Futures carry high risk.
#bitcoin #BTC #ETH #sol #bnb
$BTC $ETH $SOL
A lot of traders were buying these pumps. Here's where the chart said SHORT instead 👇
Nov 13–14 | 4 coins | Same story
🟠 BTC/USDT
Spiked to ~$70,200, SHORT fired ~$69,300
Now ~$67,300 and still running = ~$2,000 per BTC 🔄
🔷 ETH/USDT
SHORT ~$2,075 → L.TP ~$1,900 = +$175 per ETH ✅
New SHORT running from ~$1,925 🔄
🟣 SOL/USDT
S.TP hit at the ~$82 spike, SHORT ~$81.00 → L.TP ~$75.40 = +$5.60 per SOL ✅
🟡 BNB/USDT
Spiked to ~$650, SHORT ~$643 → L.TP ~$614 = +$29 per BNB ✅
━━━━━━━━━━━━━━
Same pattern on all four:
Sharp spike up → crowd gets excited → price reverses
━━━━━━━━━━━━━━
When price rips higher fast, it feels like the start of a trend. Often it's the end of a move, and late buyers become the exit liquidity for everyone who bought lower.
The chart doesn't feel the excitement. It reads structure and waits for the signal. 🎯
(Not every spike reverses. That's why every trade has a stop loss.)
💬 COMMENT: Did you buy the spike or wait?
🟢 Bought the breakout
🔴 Shorted the spike
🟡 Waited on the sidelines
⚠️ Not financial advice. Futures carry high risk.
#bitcoin #BTC #ETH #sol #bnb
$BTC $ETH $SOL